

Tenants have more space than they need. Michael Walker, CEO of SpaceLogik discusses how technology is solving for space efficiency and mitigating underutilization.
VIEW PRESENTATION:


VIDEO TRANSCRIPT:
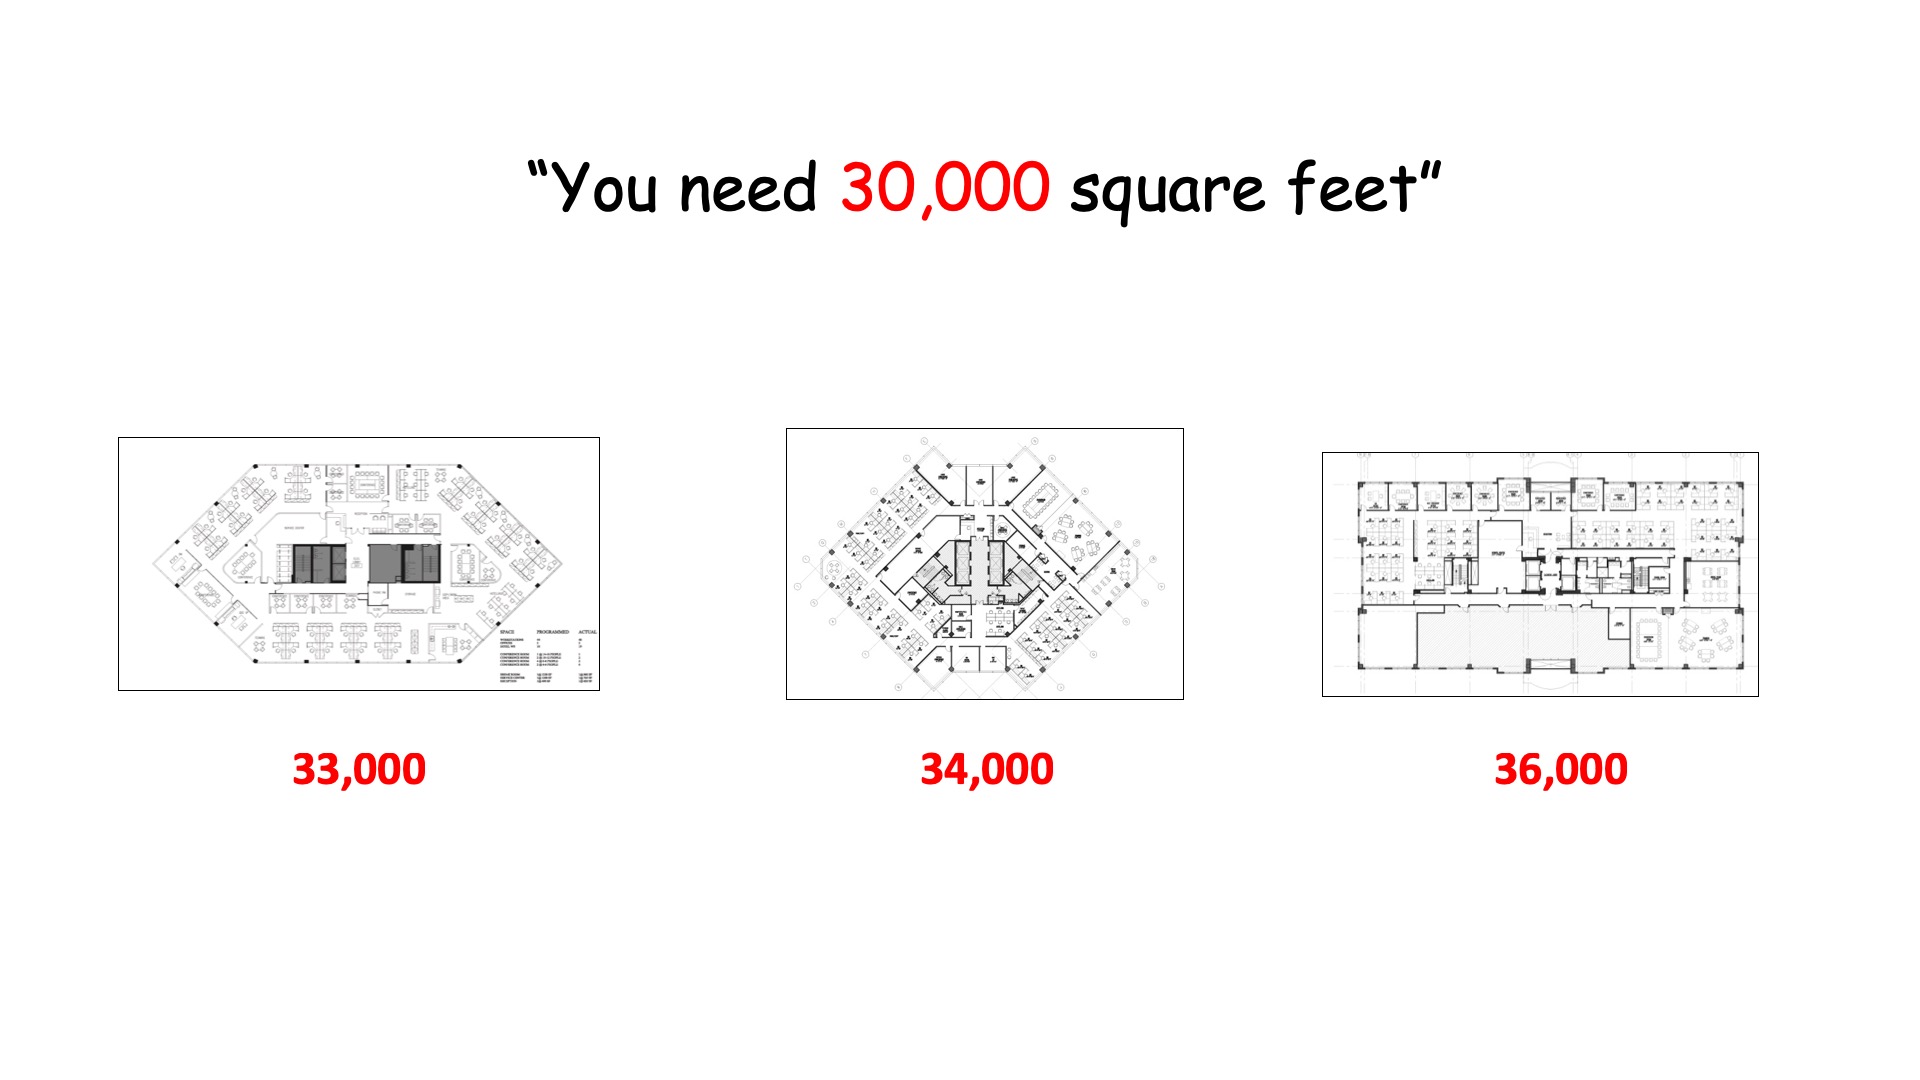
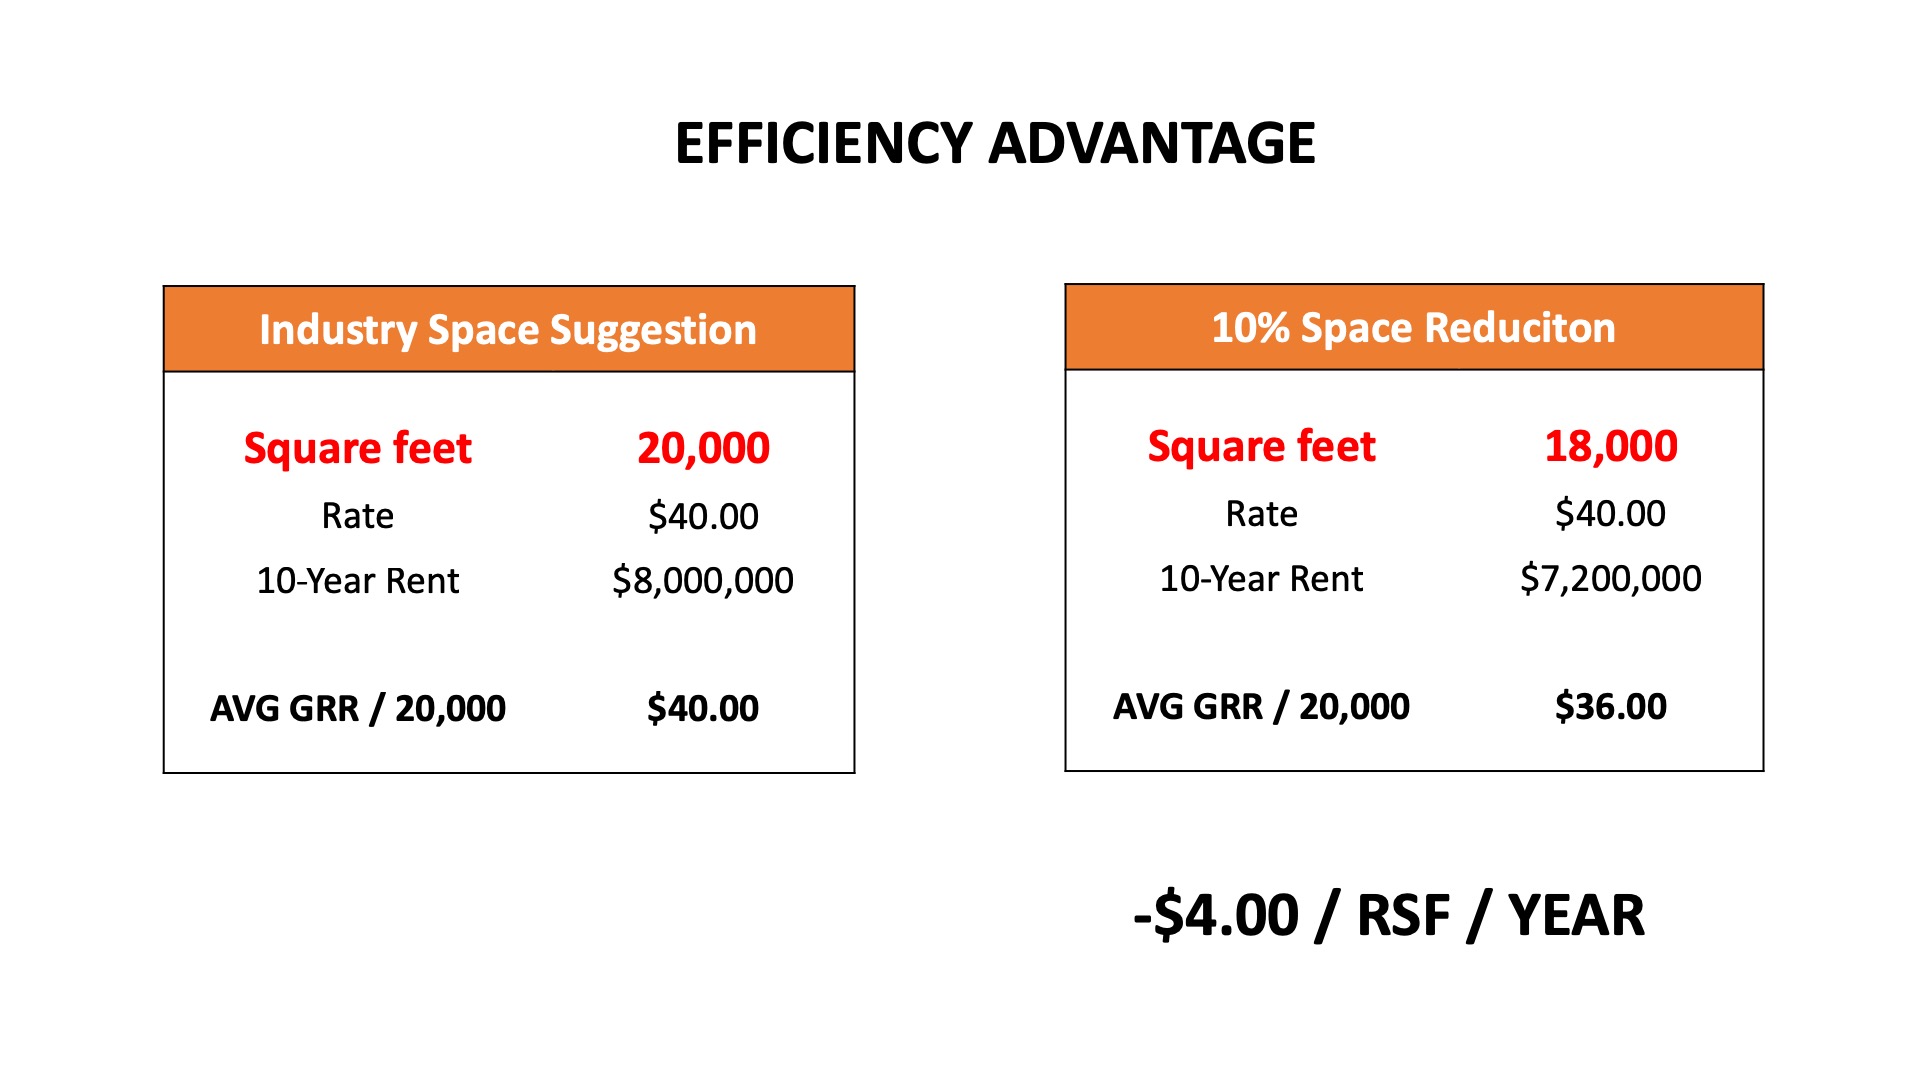
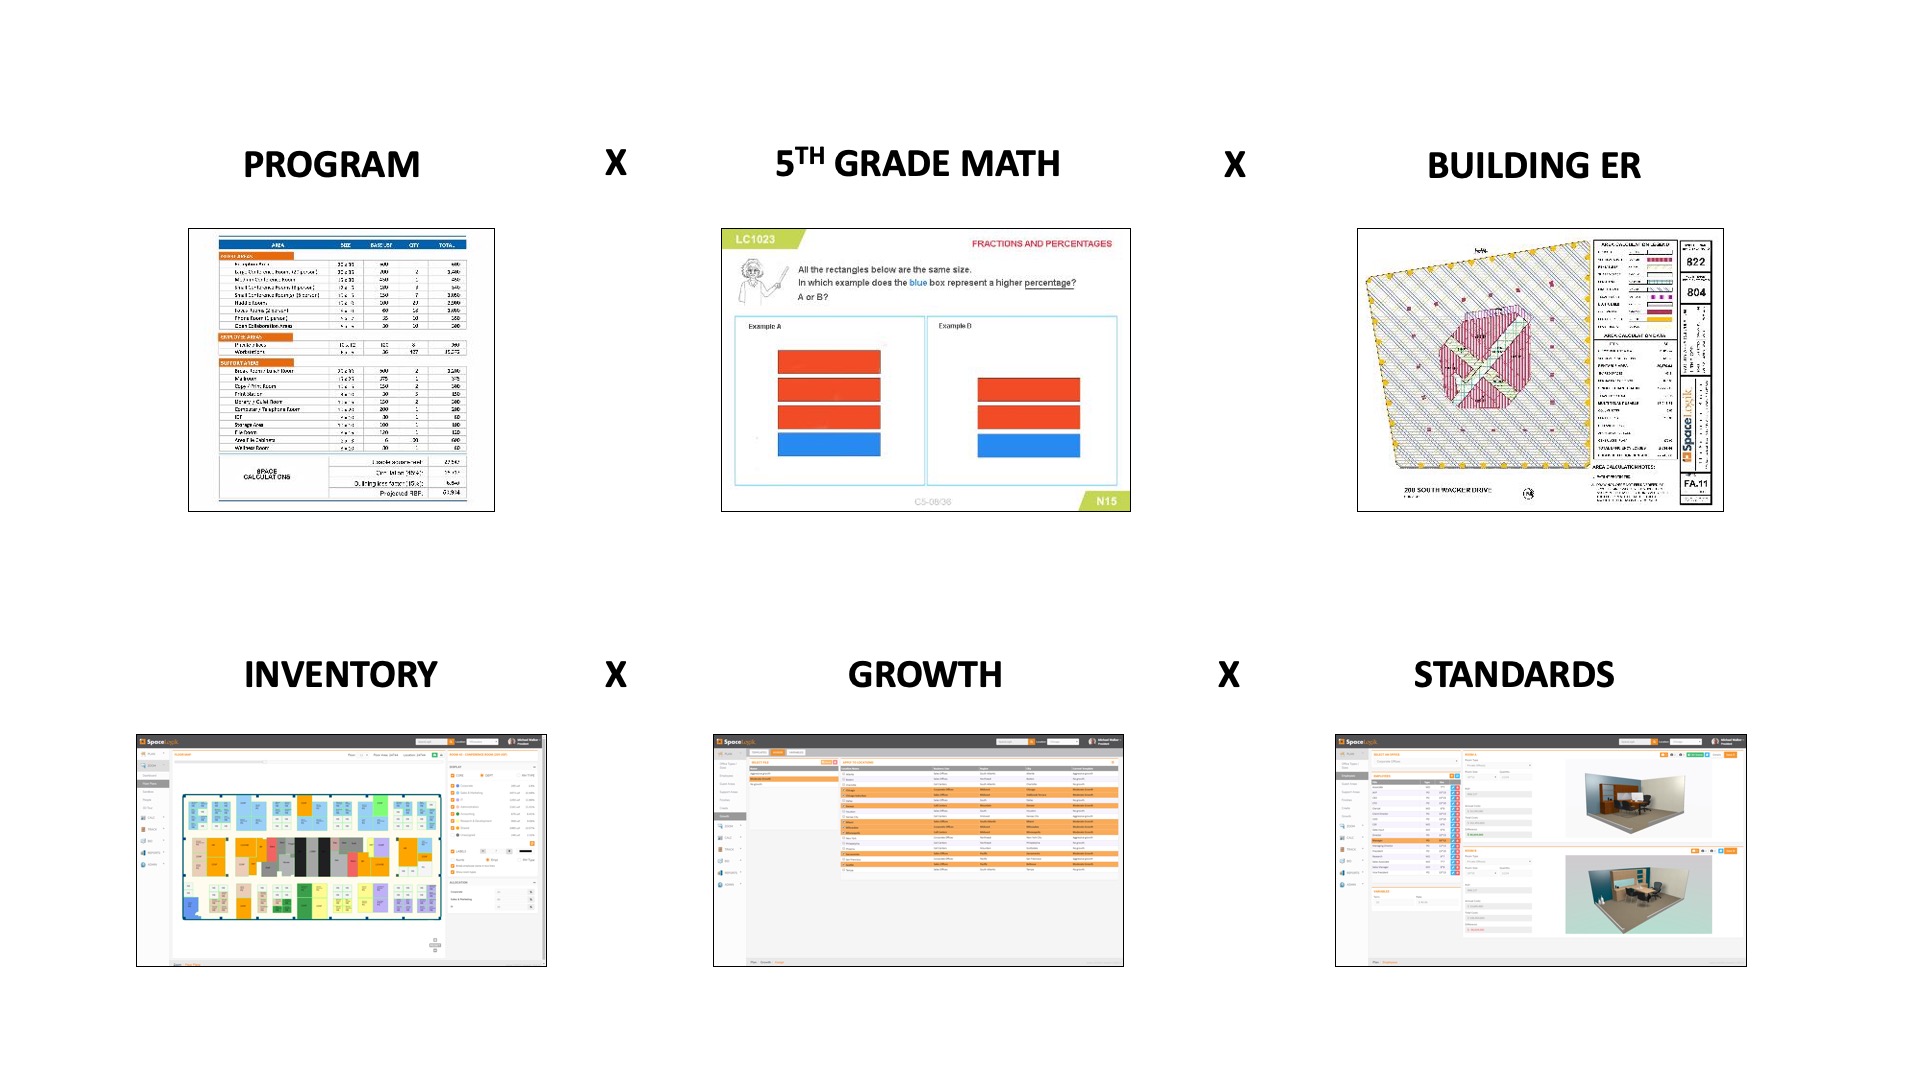
Hello, I'm Mike Walker I'm the founder of SpaceLogik. I've been in commercial real estate for 30 years now but the last 20 of them I've really been focused more on corporate space optimization. This obsession with space efficiency really grew out of frustration originally when I was doing real estate transactions and I would bring my clients into an architect to help them project how much space they needed and they would say for example that you need 30,000 square feet, as a broker I would take the client out to the market, show them buildings, send out RFP’s and then the space plans would come back at 33, 35, 36000 square feet. So this obviously messed up the transaction. We had to either reduce the scope of the space, look for cheaper buildings or go over budget. I also noticed that there were inconsistencies on the plans that look like they could be designed more efficiently. So I saw it as an opportunity, if I could figure out a way to make that process smoother, but then also help reduce space at the same time it would be the same as negotiating 4 dollars per square foot, per year off the rental rate.
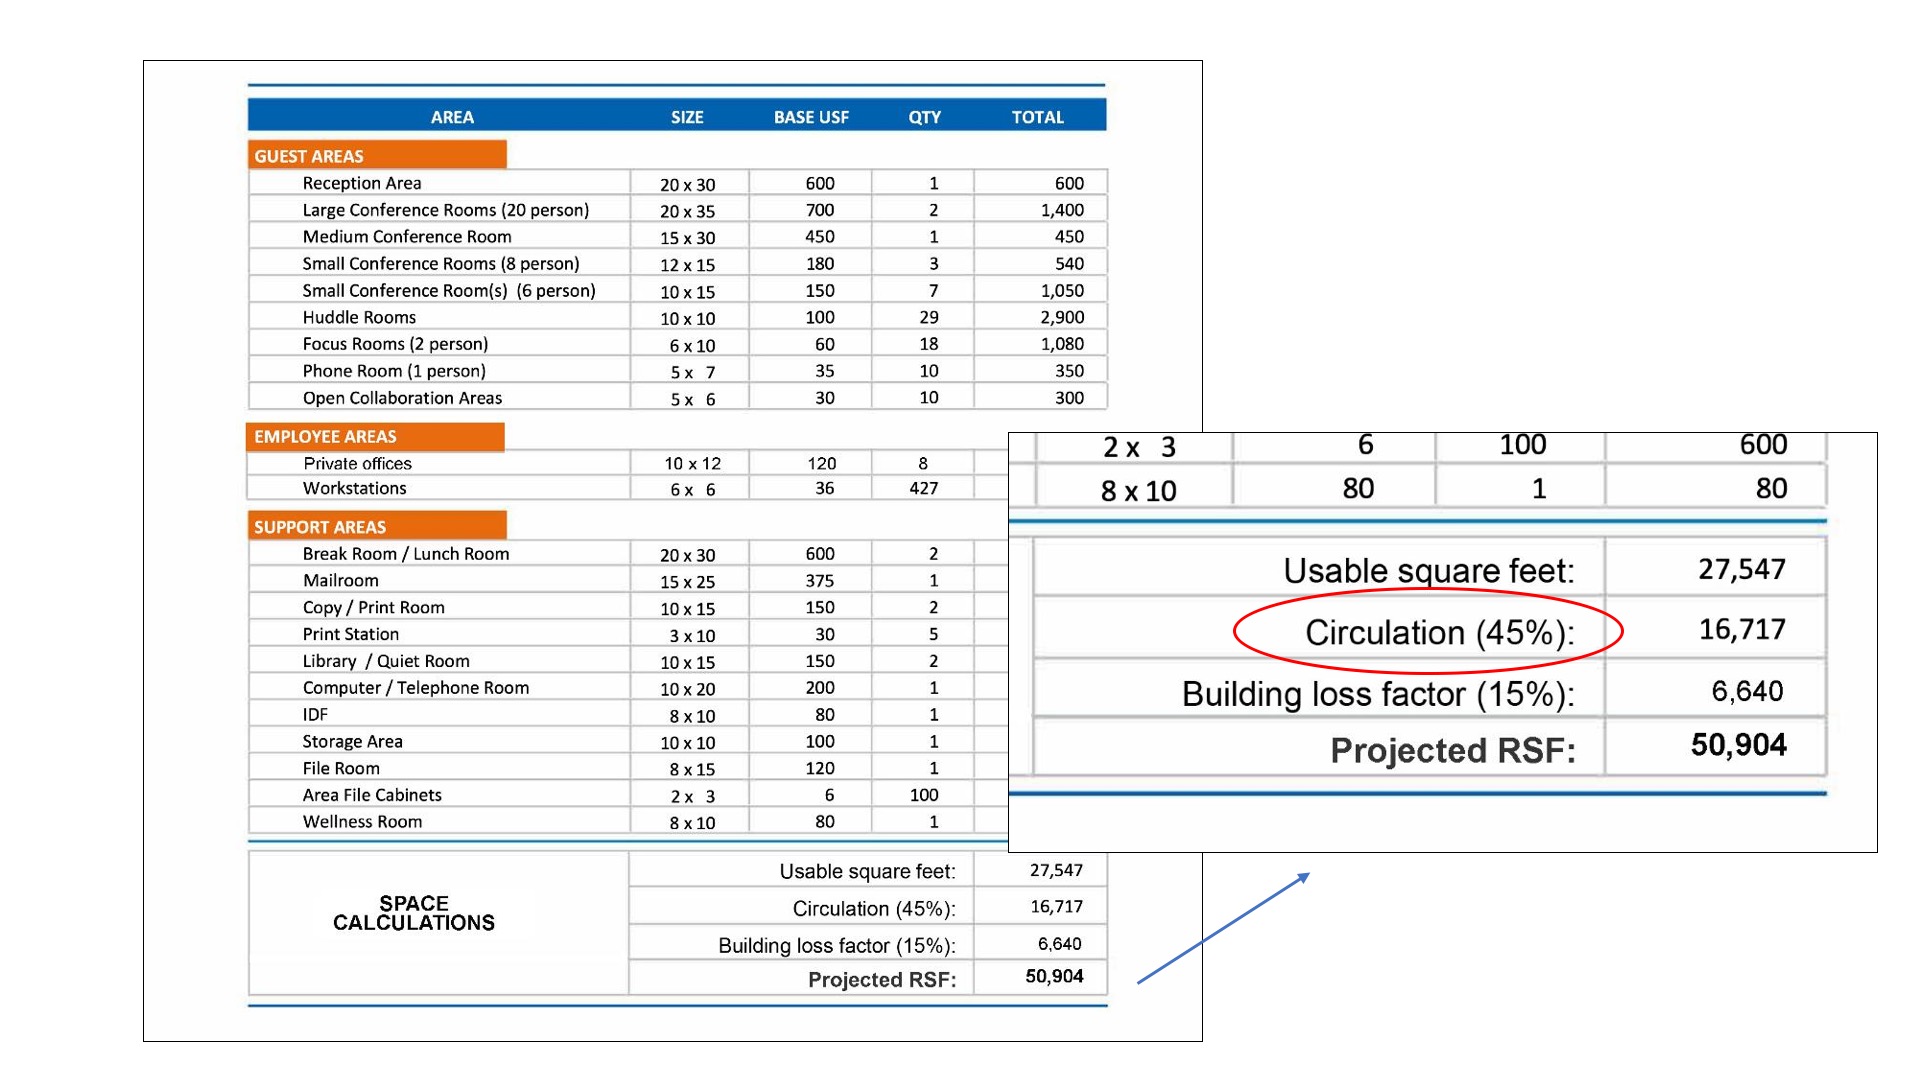
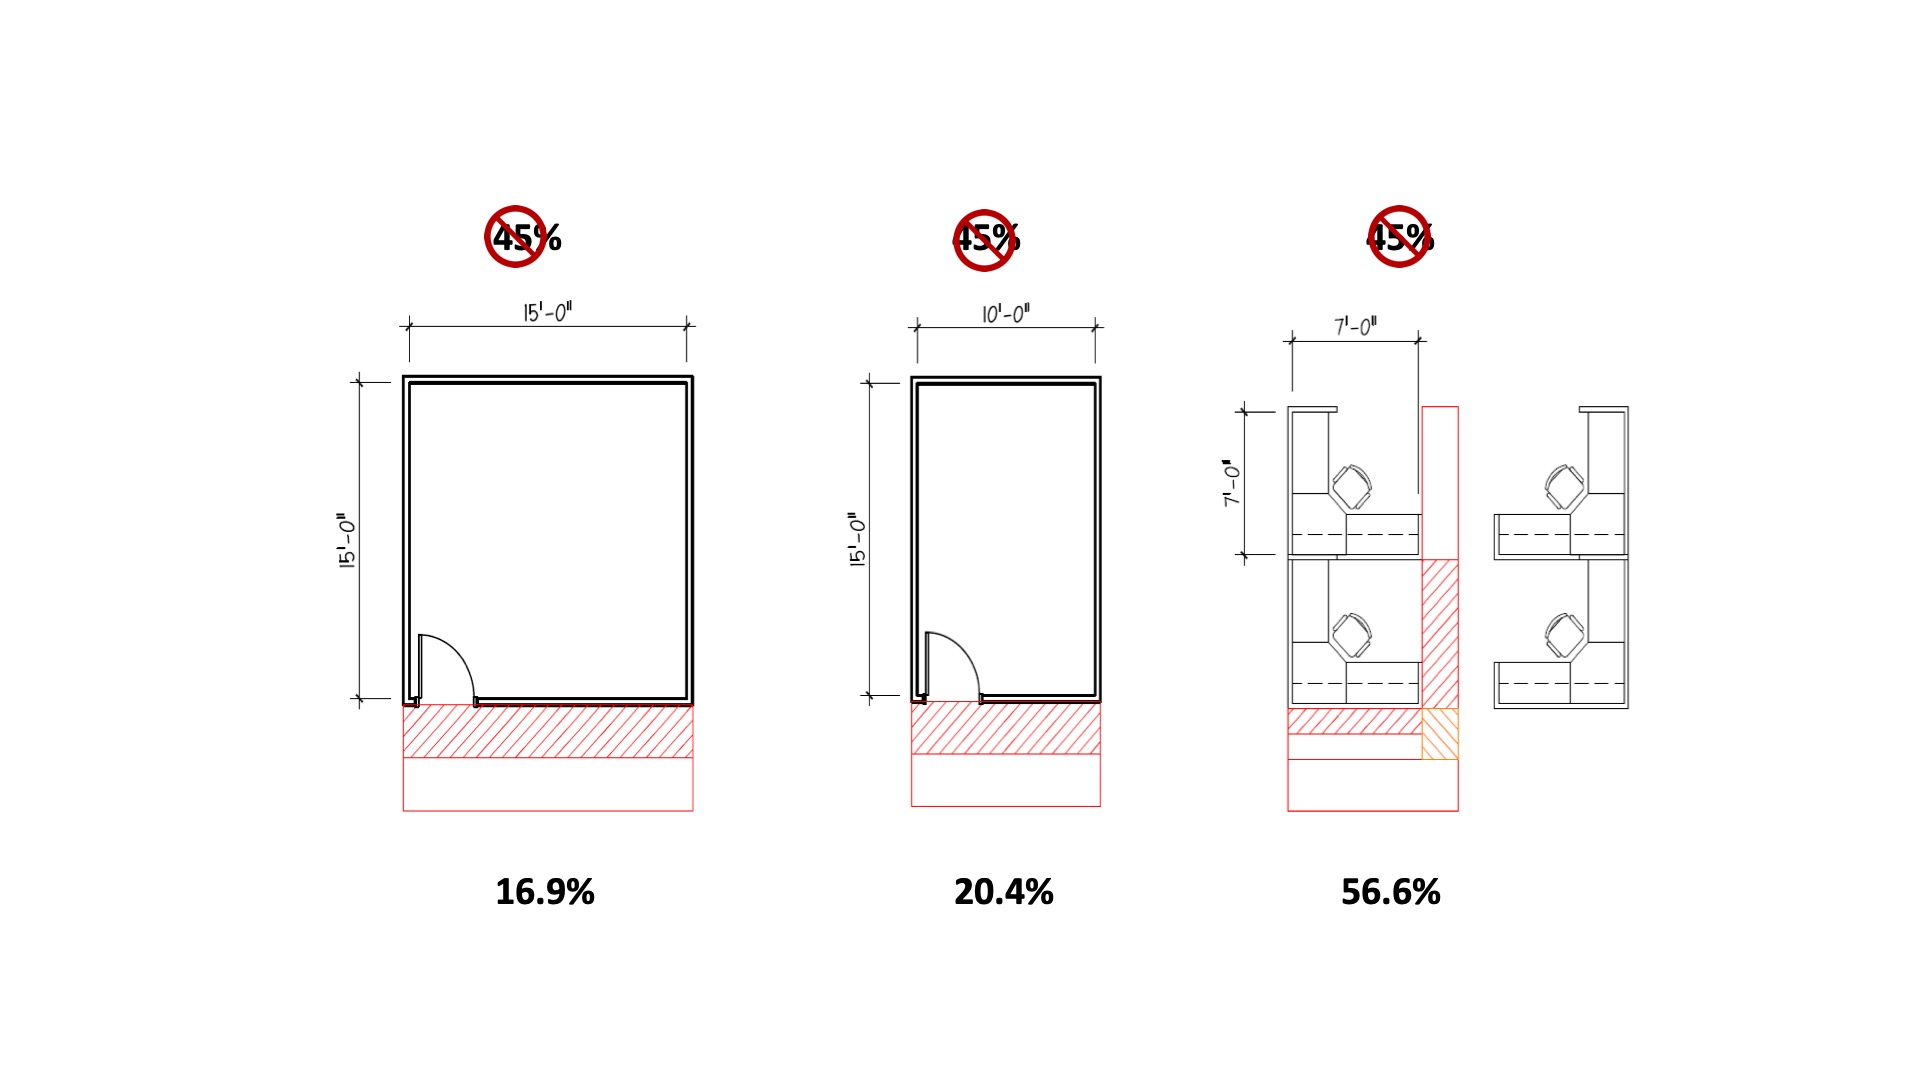
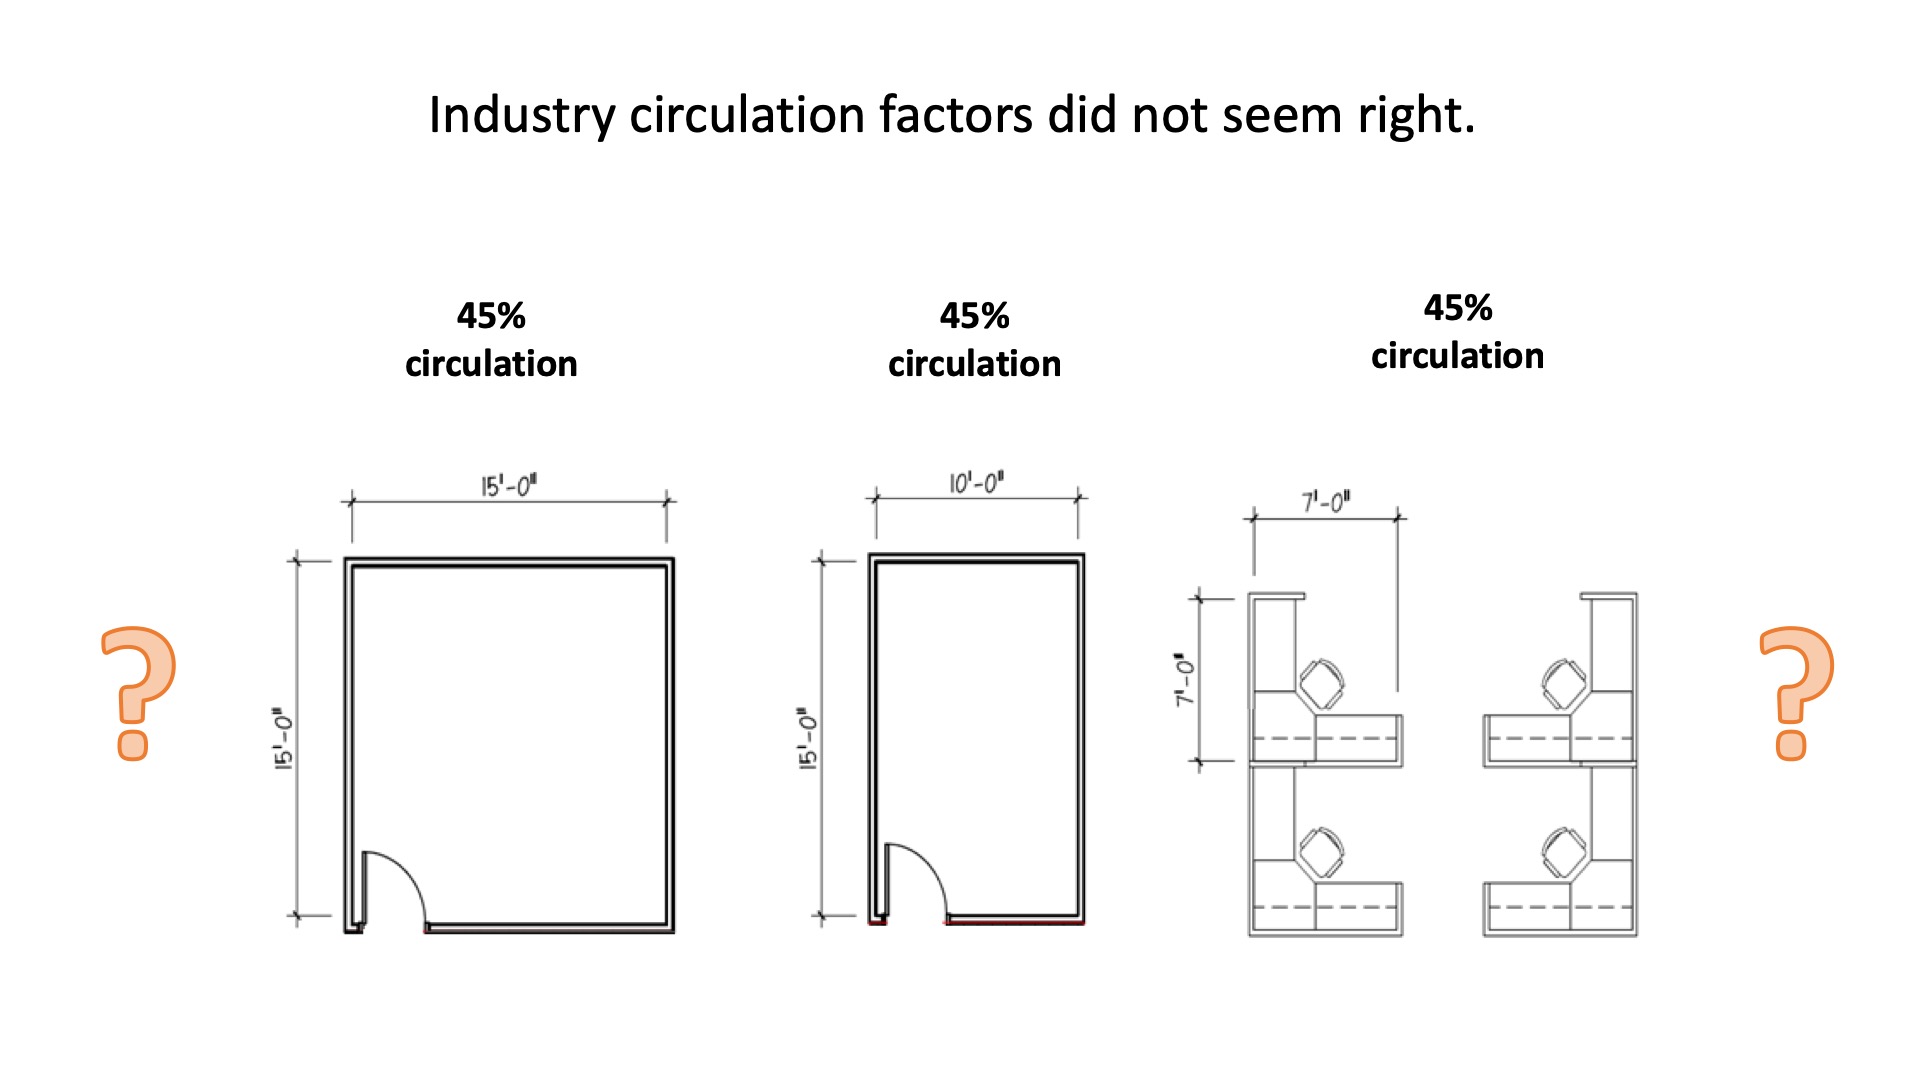
So we started focusing on that where I started was what the industry calls a space program, that's a list of the areas that a tenant wants within their space and at the end of the day the architect adds a circulation factor. And so I started looking at that and asking questions and no one could tell me really where that number came from and why some companies used 40 percent versus 45 versus 50. It also made no sense that they were using the same percentage for different sized areas.
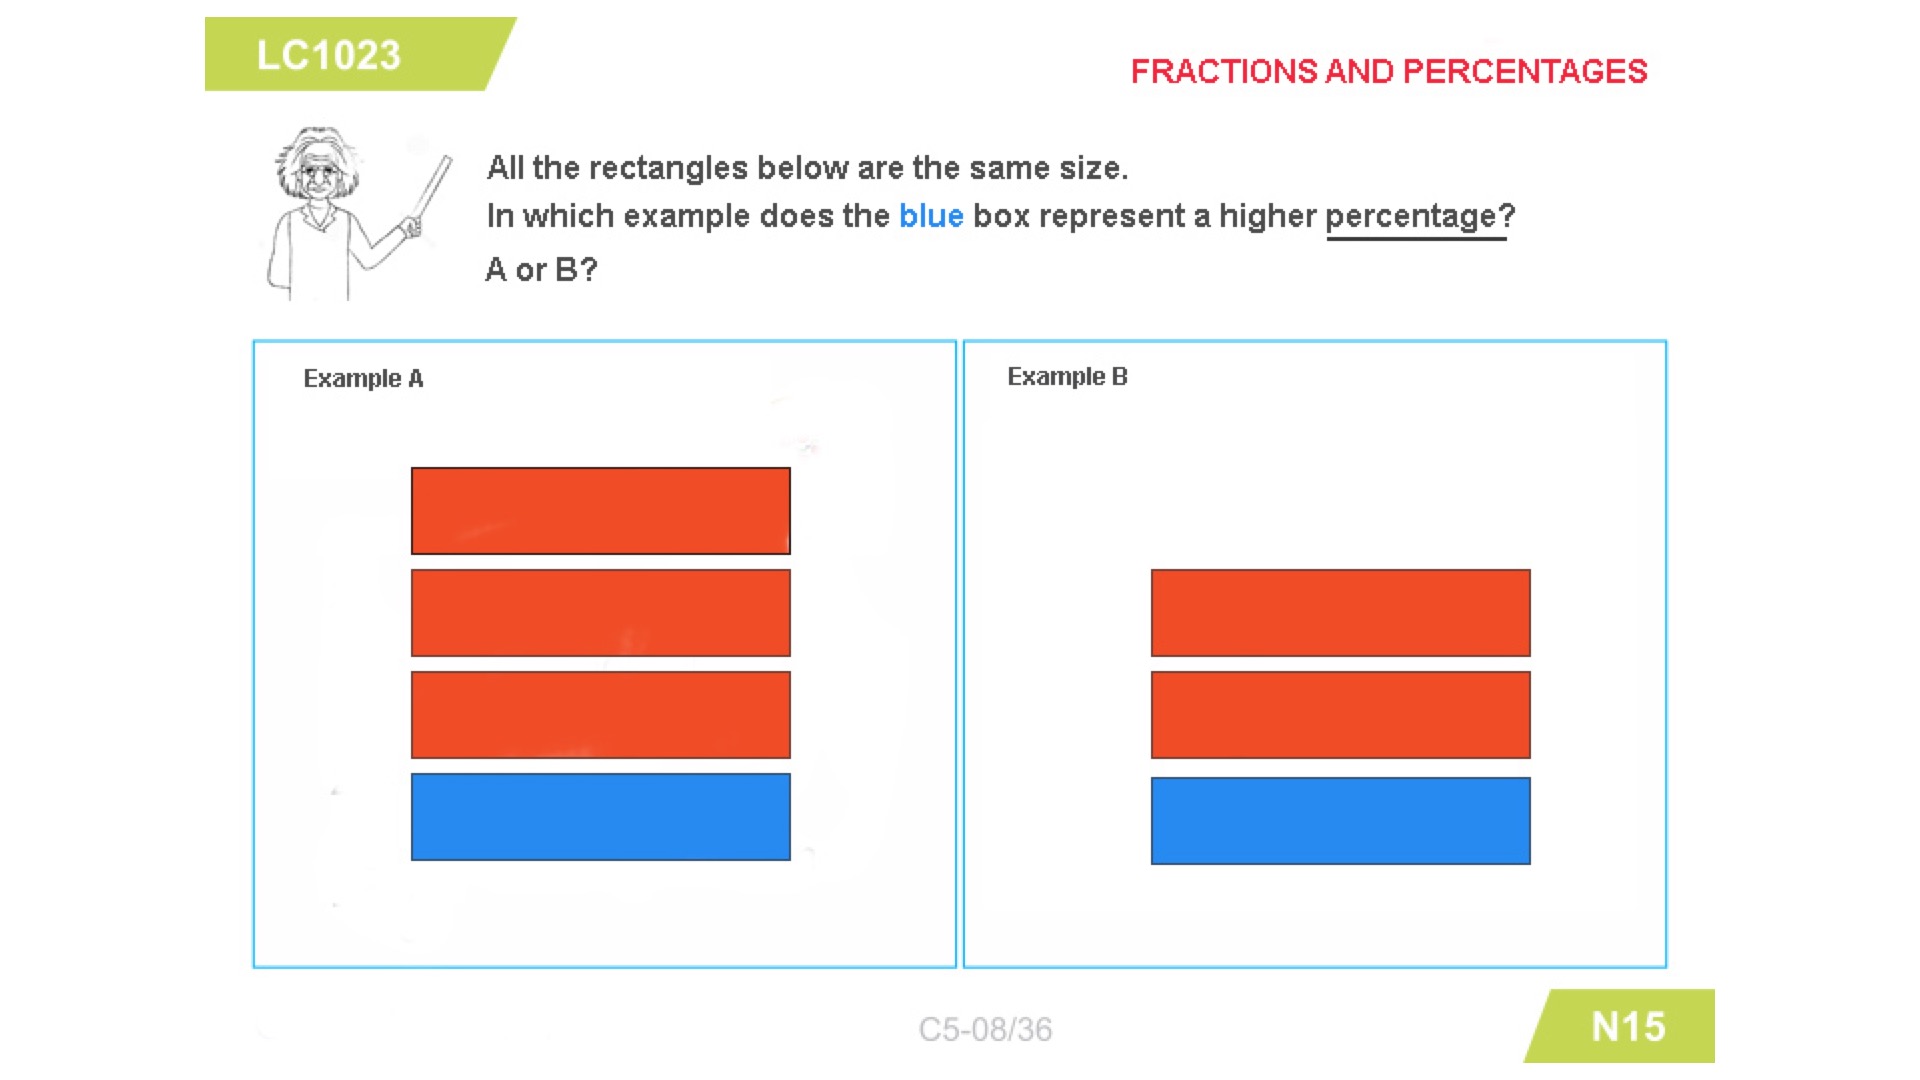
Ironically I was sitting there doing homework with my 10 year old daughter and a math problem came up that was just like this Einstein asking what percentage of these two figures do the blue box represent. And the light bulb went off on my head. Sent her to bed early, sat down started doing calculations. What I found is that it was absolutely right, the bigger the area the less circulation you need.
That led to the next question, is a 30 trillion dollar industry Smarter Than A Fifth Grader?
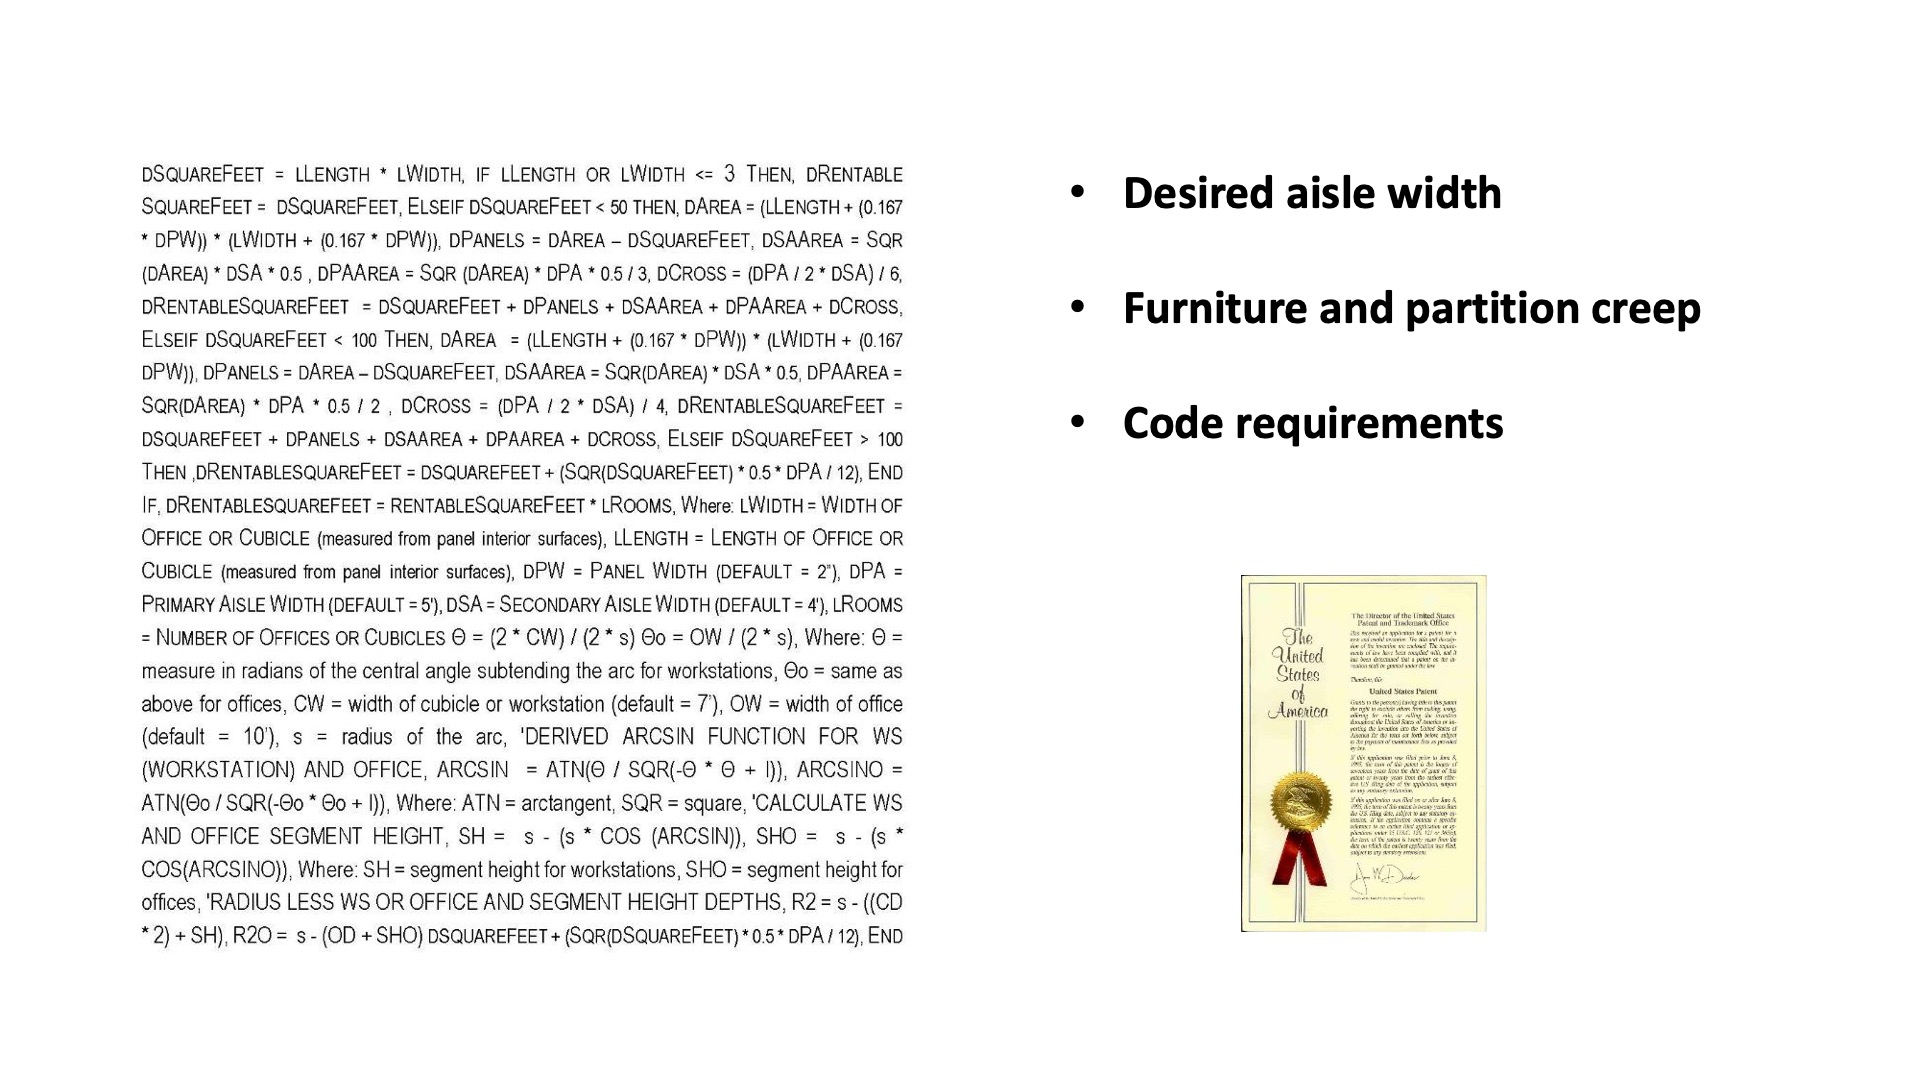
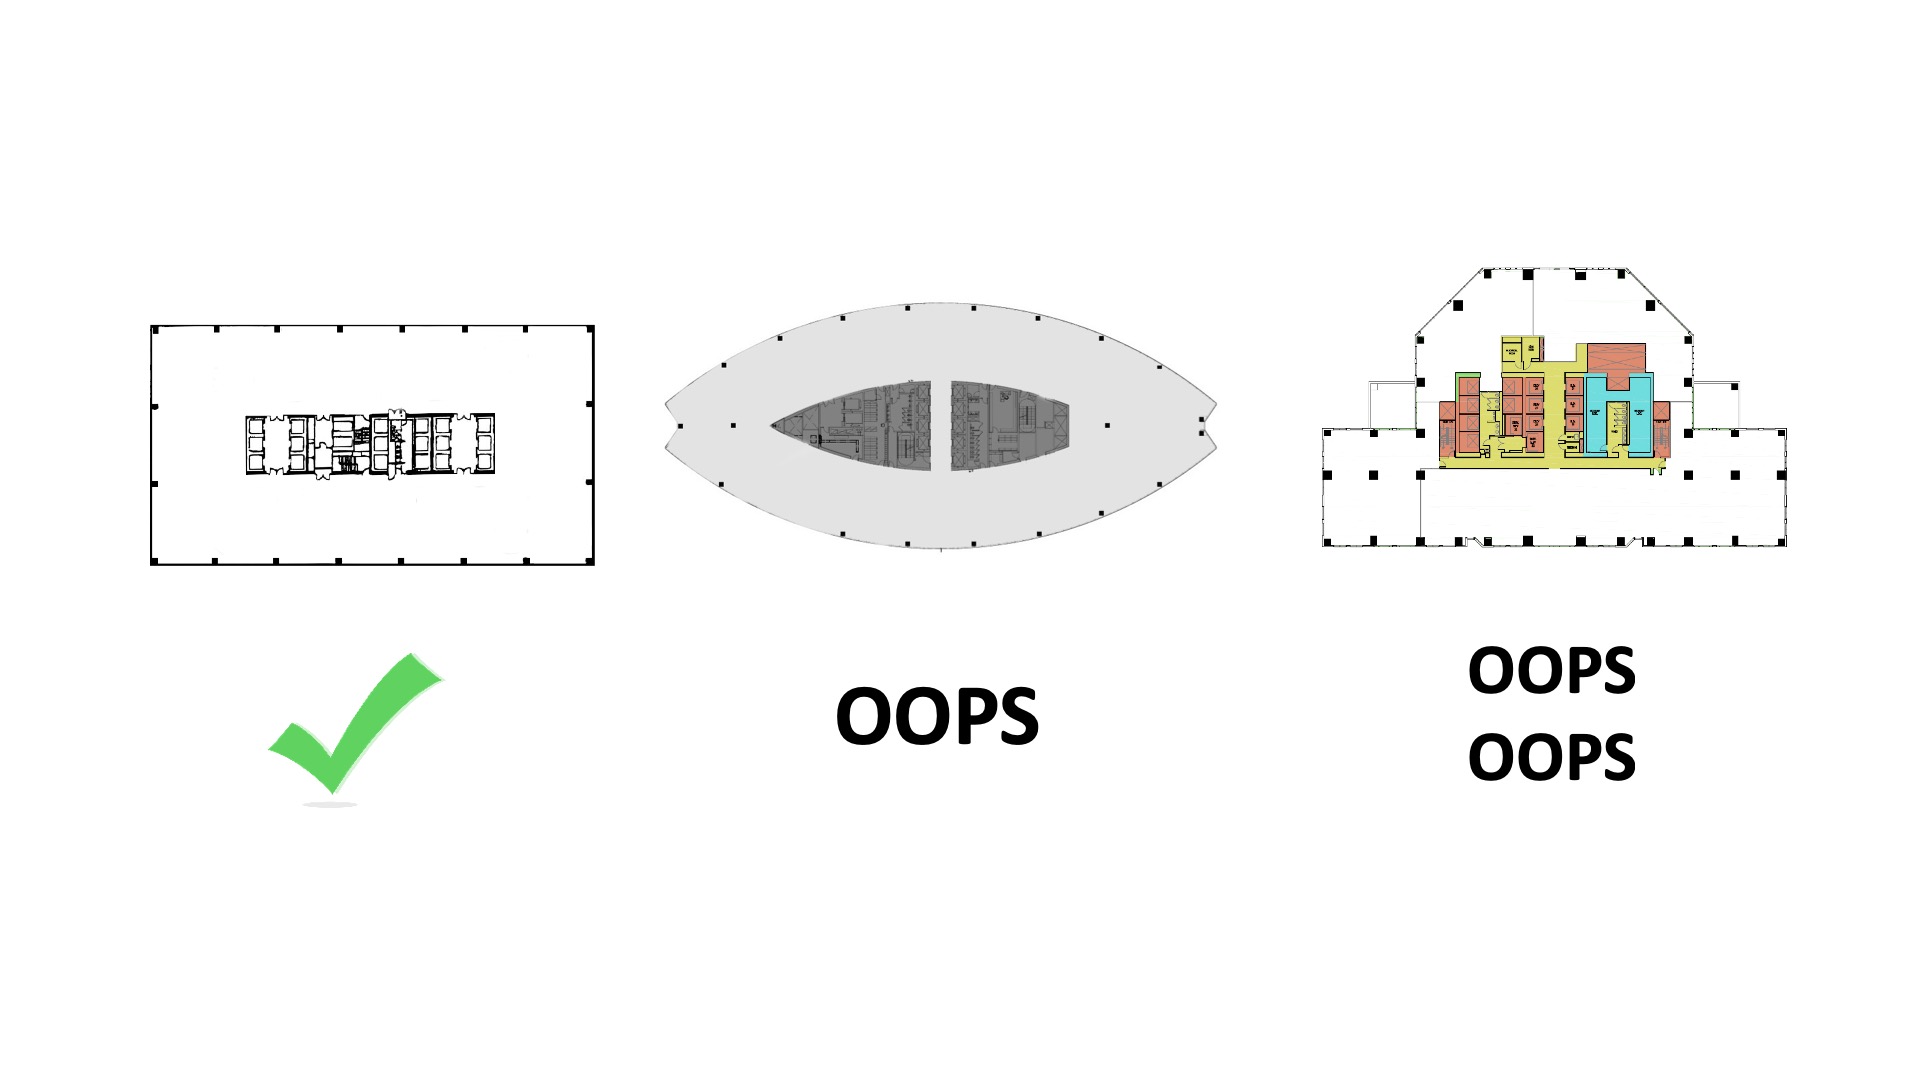
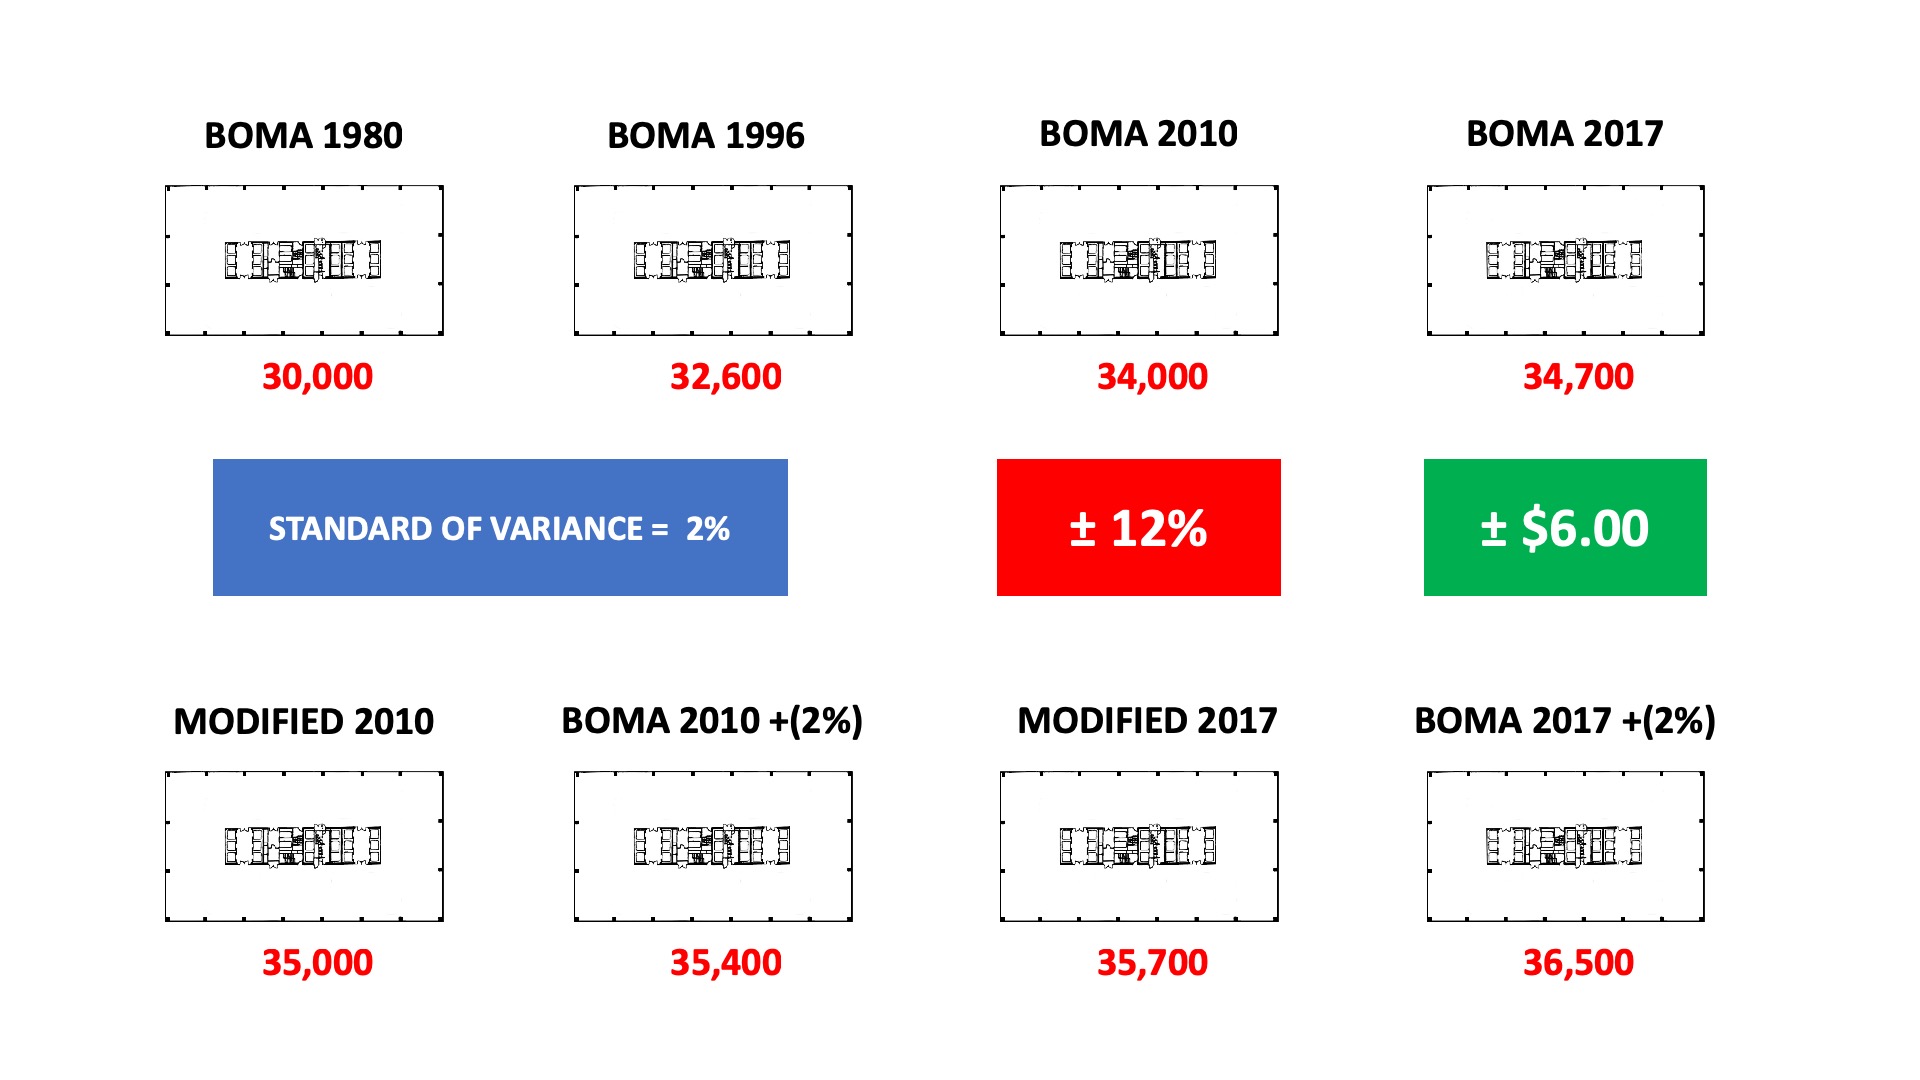
In any case we came up with an algorithm that applies a circulation factor on a per area basis and gave some variables, and actually was awarded a patent. The problem was that it worked in perfectly efficient or call it geometrically friendly office buildings, but when you had angles and curves it didn't work so well. So we had to go back to the drawing board and adjust for that building efficiency. But it was harder than we thought because BOMA went to changing their standards three times in ‘96, 2010 and 2017, each time allowing the landlord to increase the rentable square foot of their building without physically changing anything. Additionally BOMA lets the landlords increase the size of their building on something they called the standard of variance and still be considered right.
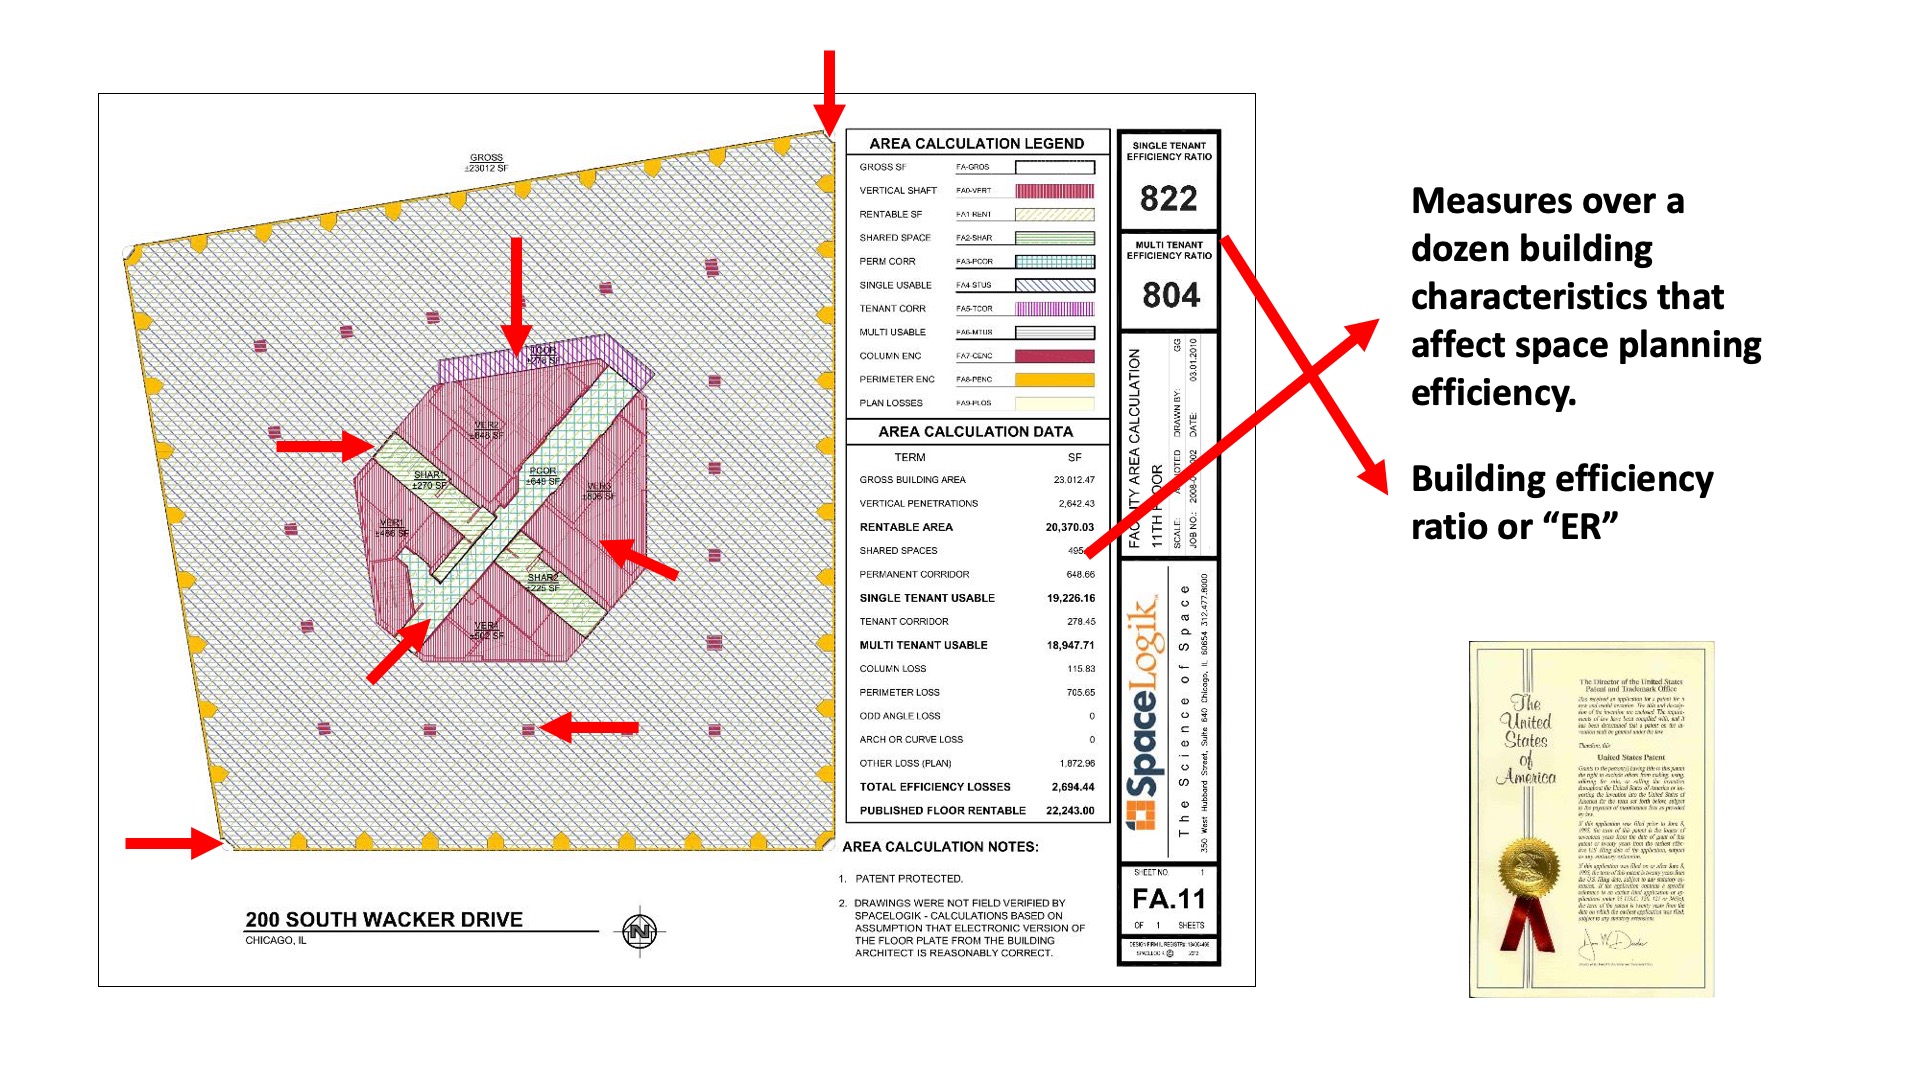
So what will happen is that if you took the same building and gave it to eight different landlords and eight different architects you would come up almost certainly with eight different rentable square footage is and that would vary by 12 percent hat we're finding and be a difference of six dollars per foot per year on the rental rate. So the way we solve for that. Is we came up with another formula for measuring the relative efficiency of office buildings and what we do is we take all of the areas that negatively affect the ability to efficiently layout space and put it into another algorithm and those might be you know columns on angles, at curves, perimeter mechanical units, core efficiency, T core, P core. And then we use that number to adjust for building build by building on how much space the tenant needs. That was patented also.
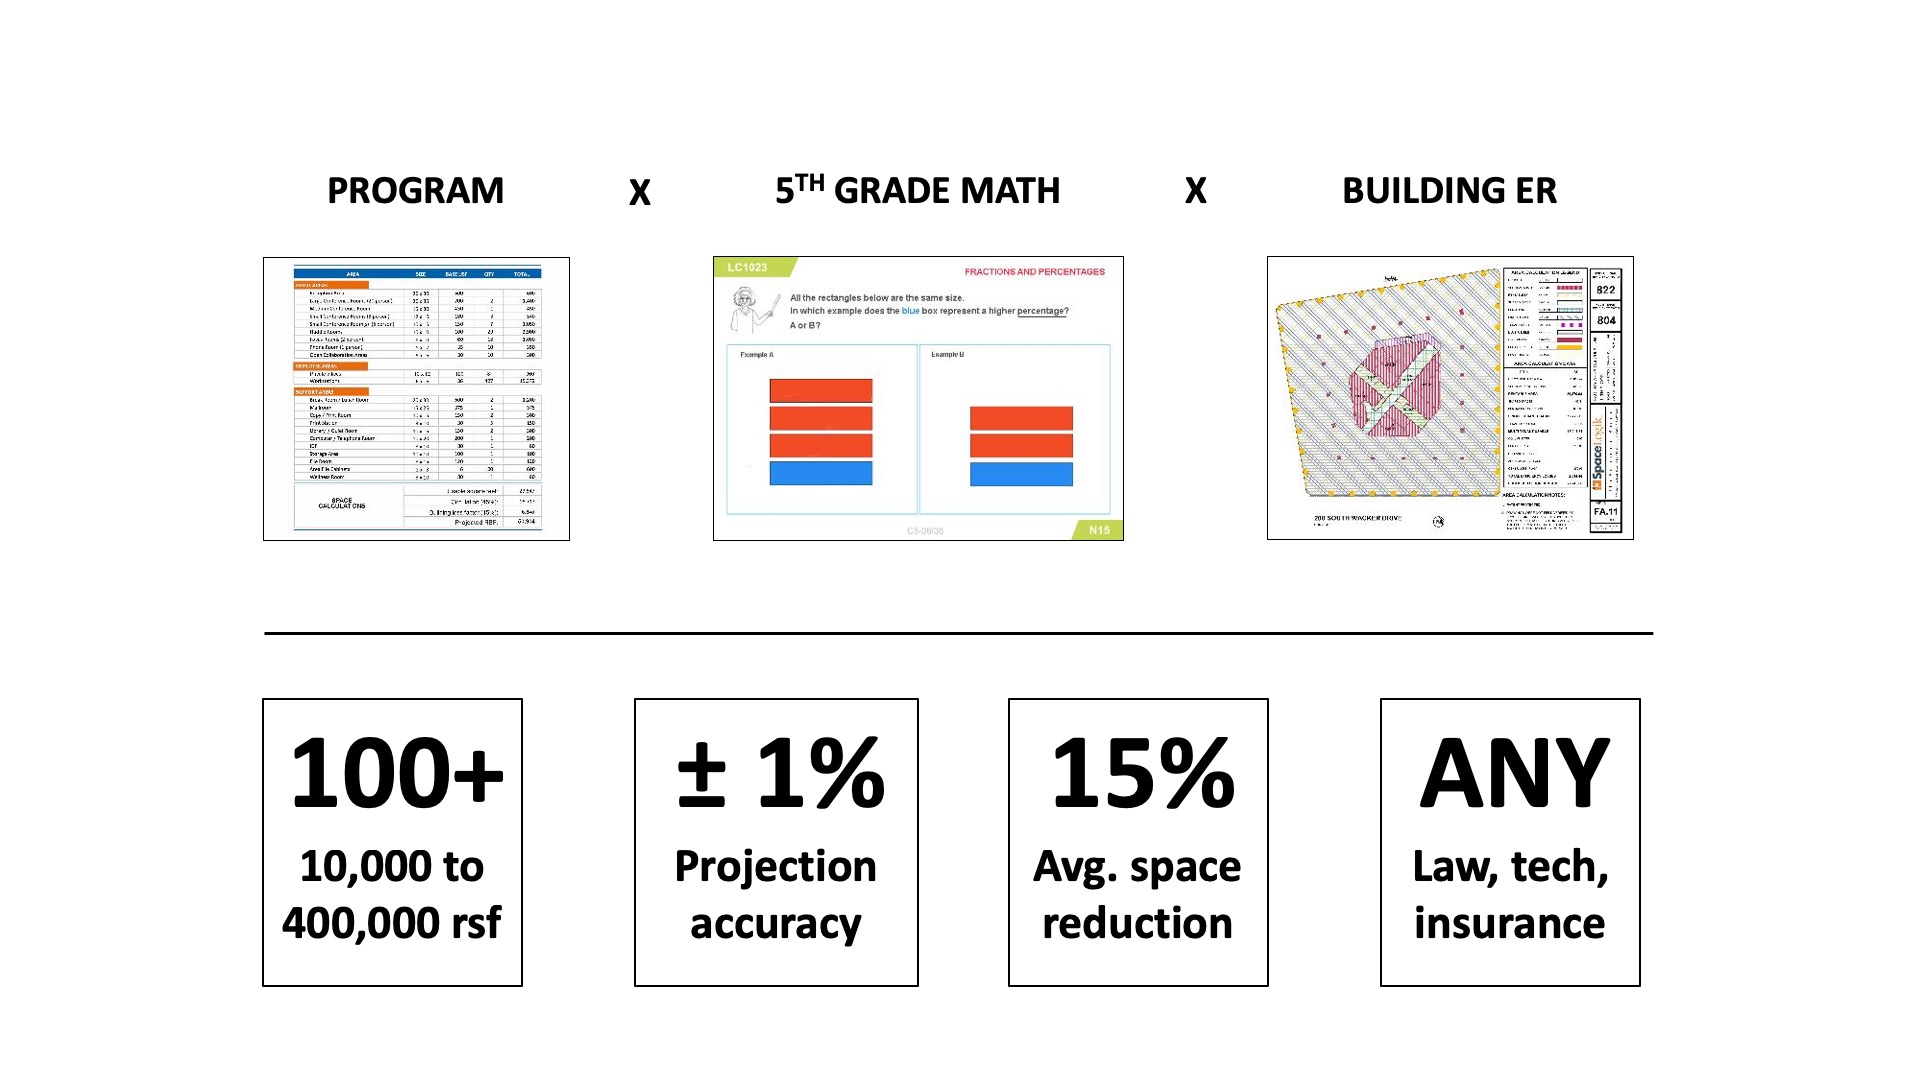
And now when we take the original program, put some fifth grade math on it and then adjust the building ER we're spot on every time. So we've done well over 100 projects now between 10 and 400,000 square feet. We are usually within 1 percent but we've never been more than 2 percent off. Our average space reductions 15 percent on projects the lowest it's ever been on any of these projects is nine point eight percent. And it works for any type of office space whether it's law firms, technology, insurance, consulting.
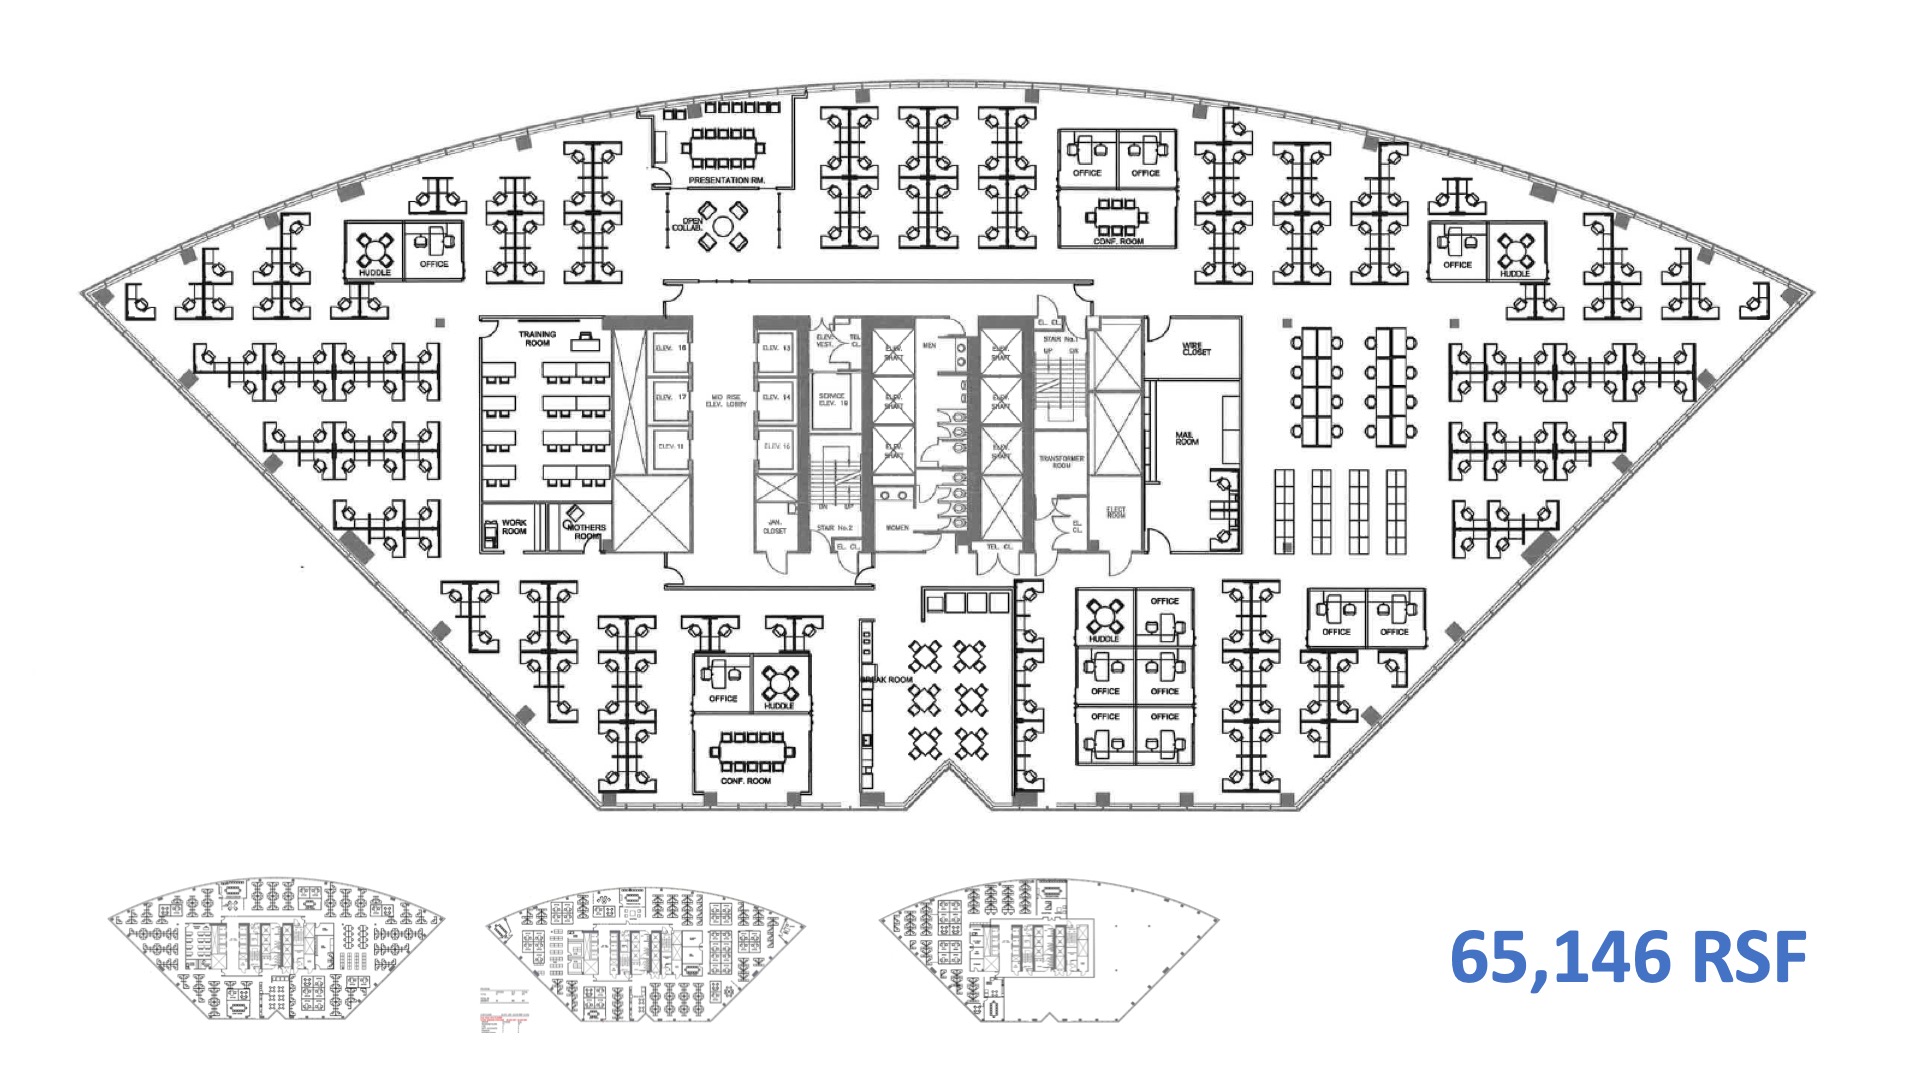
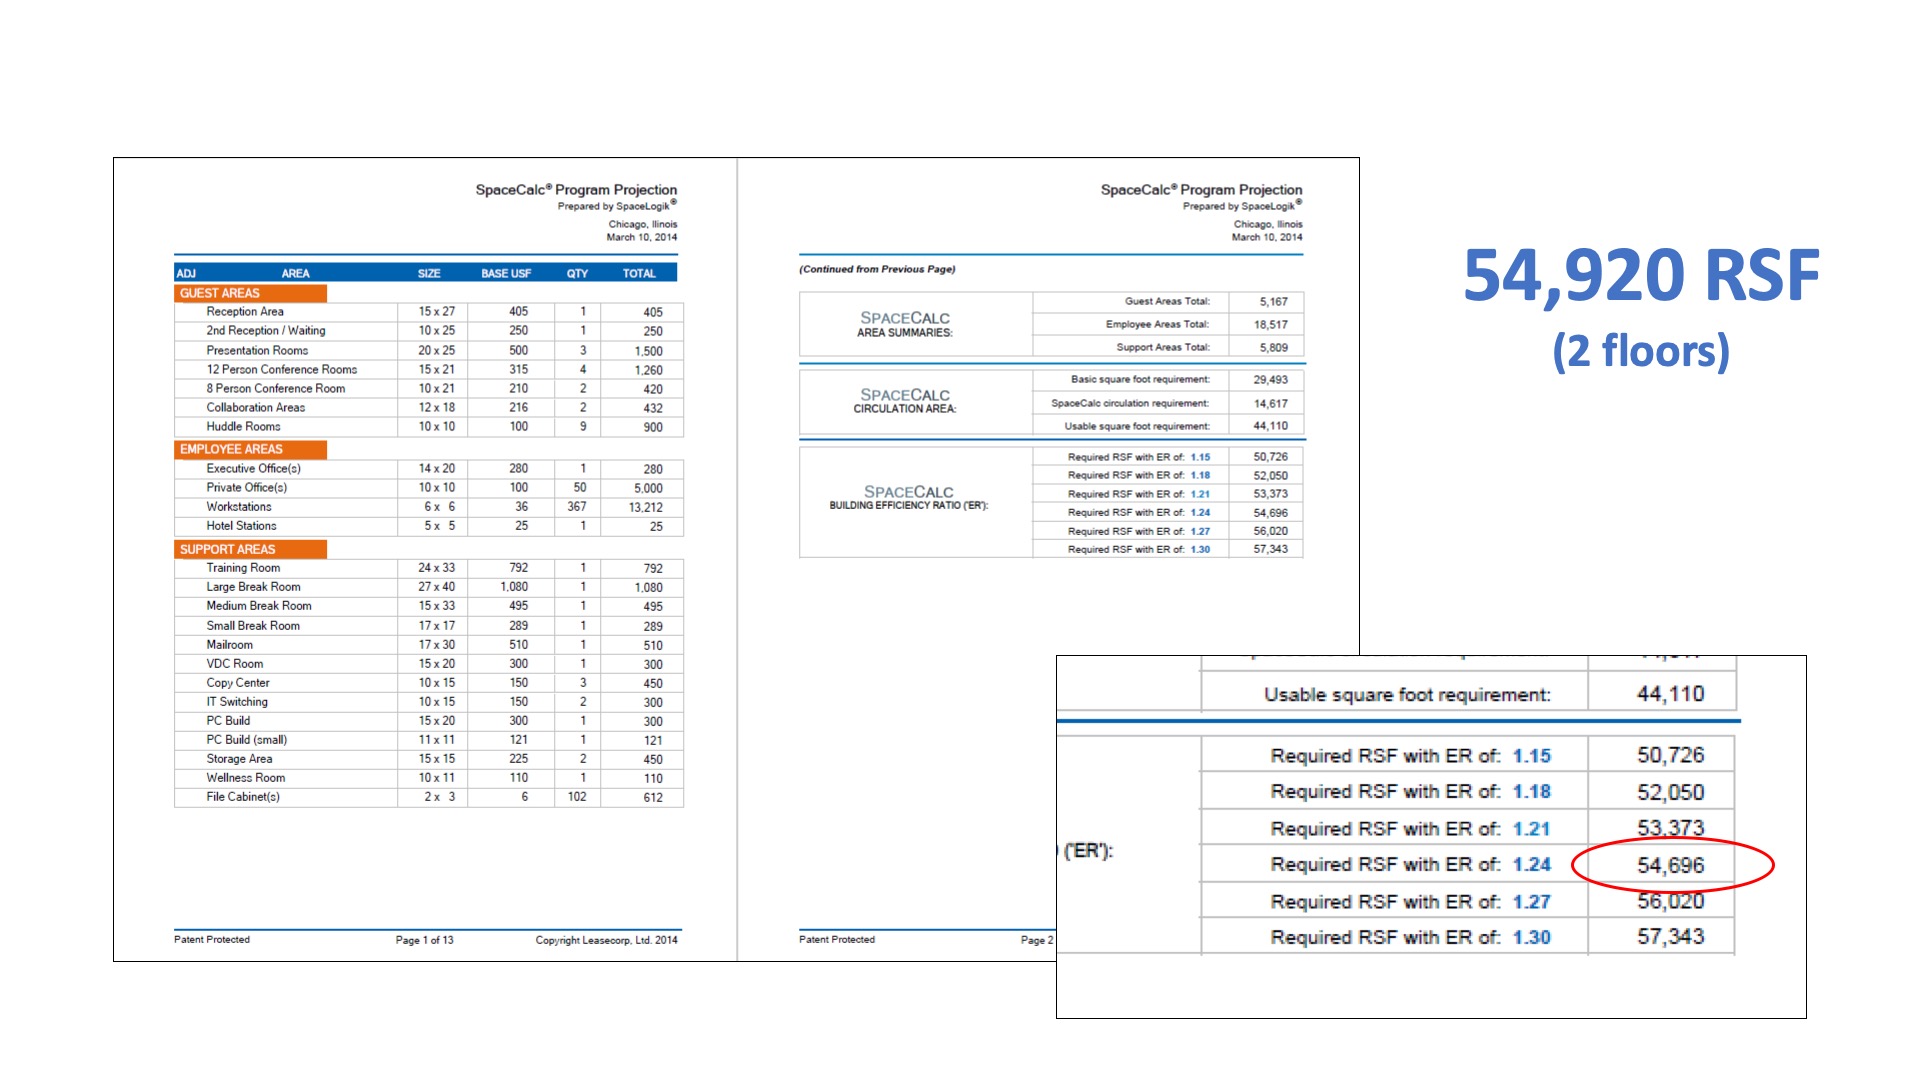
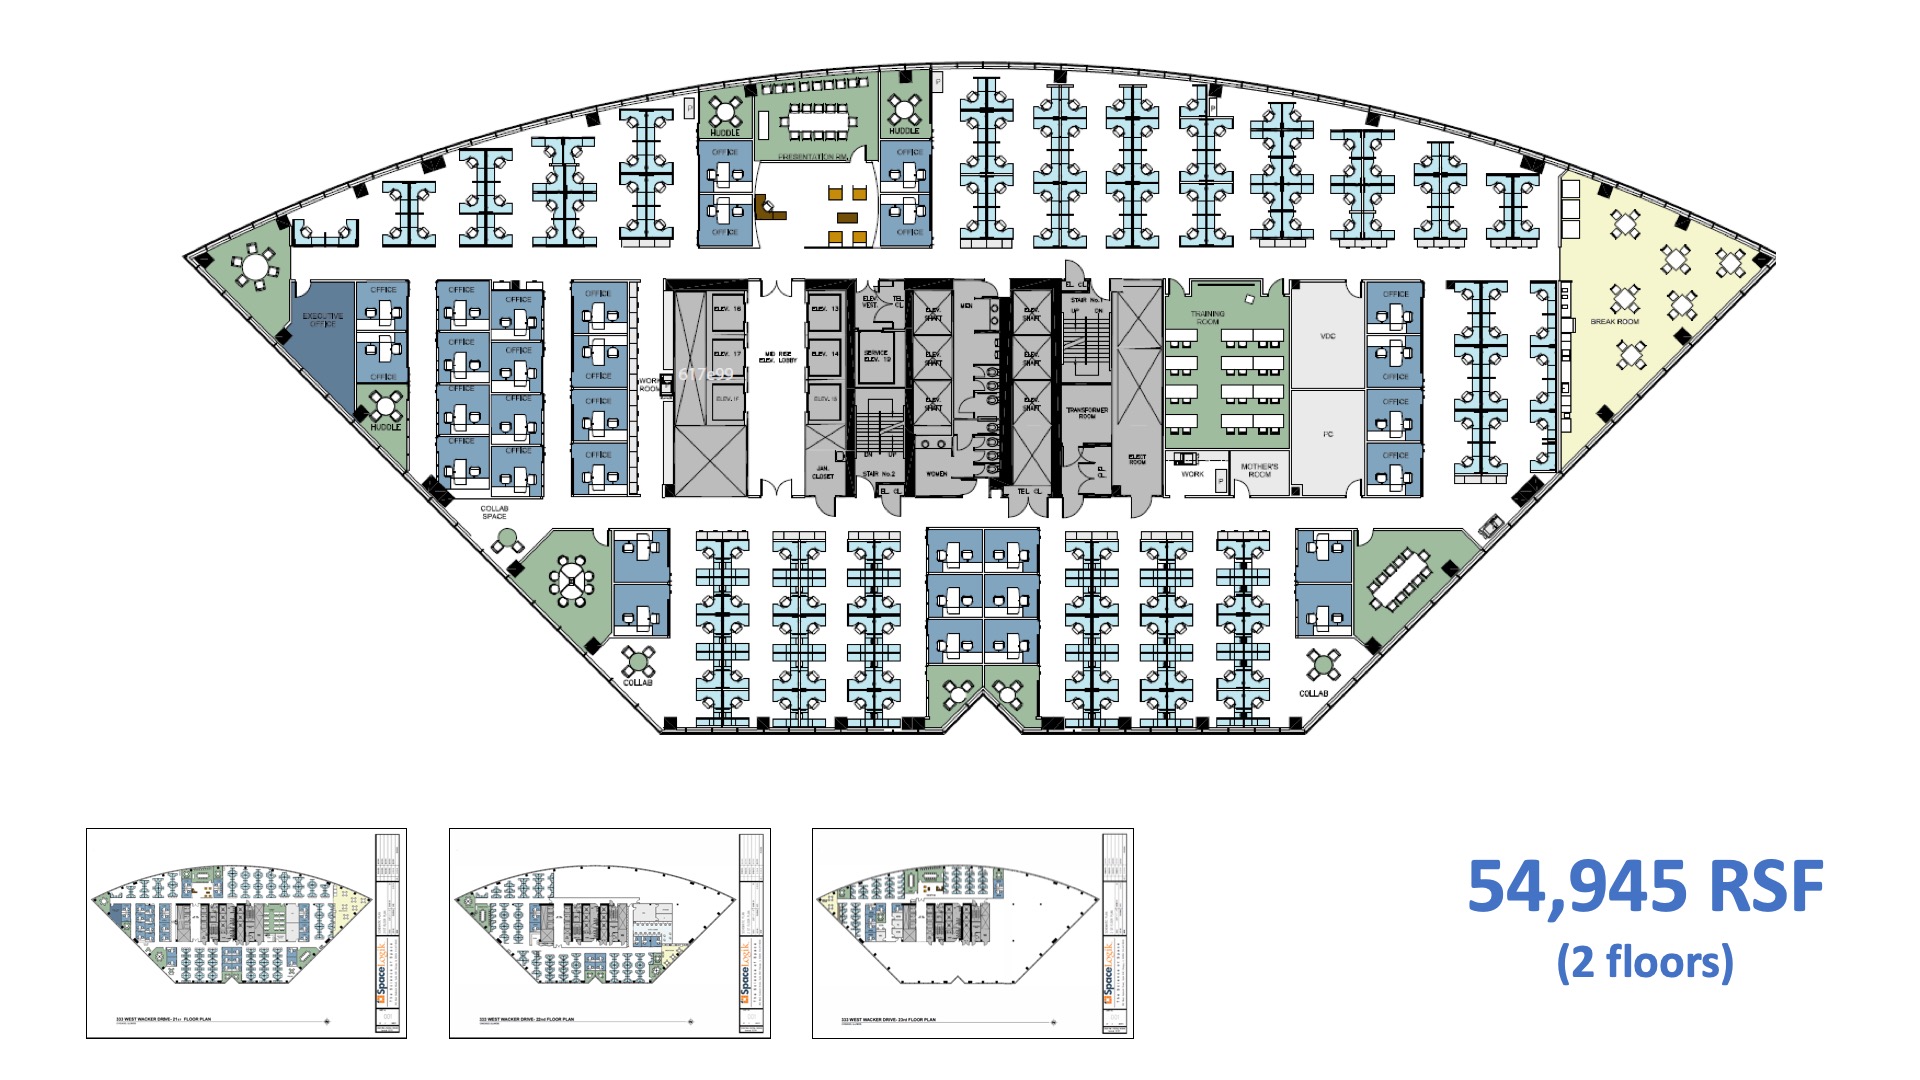
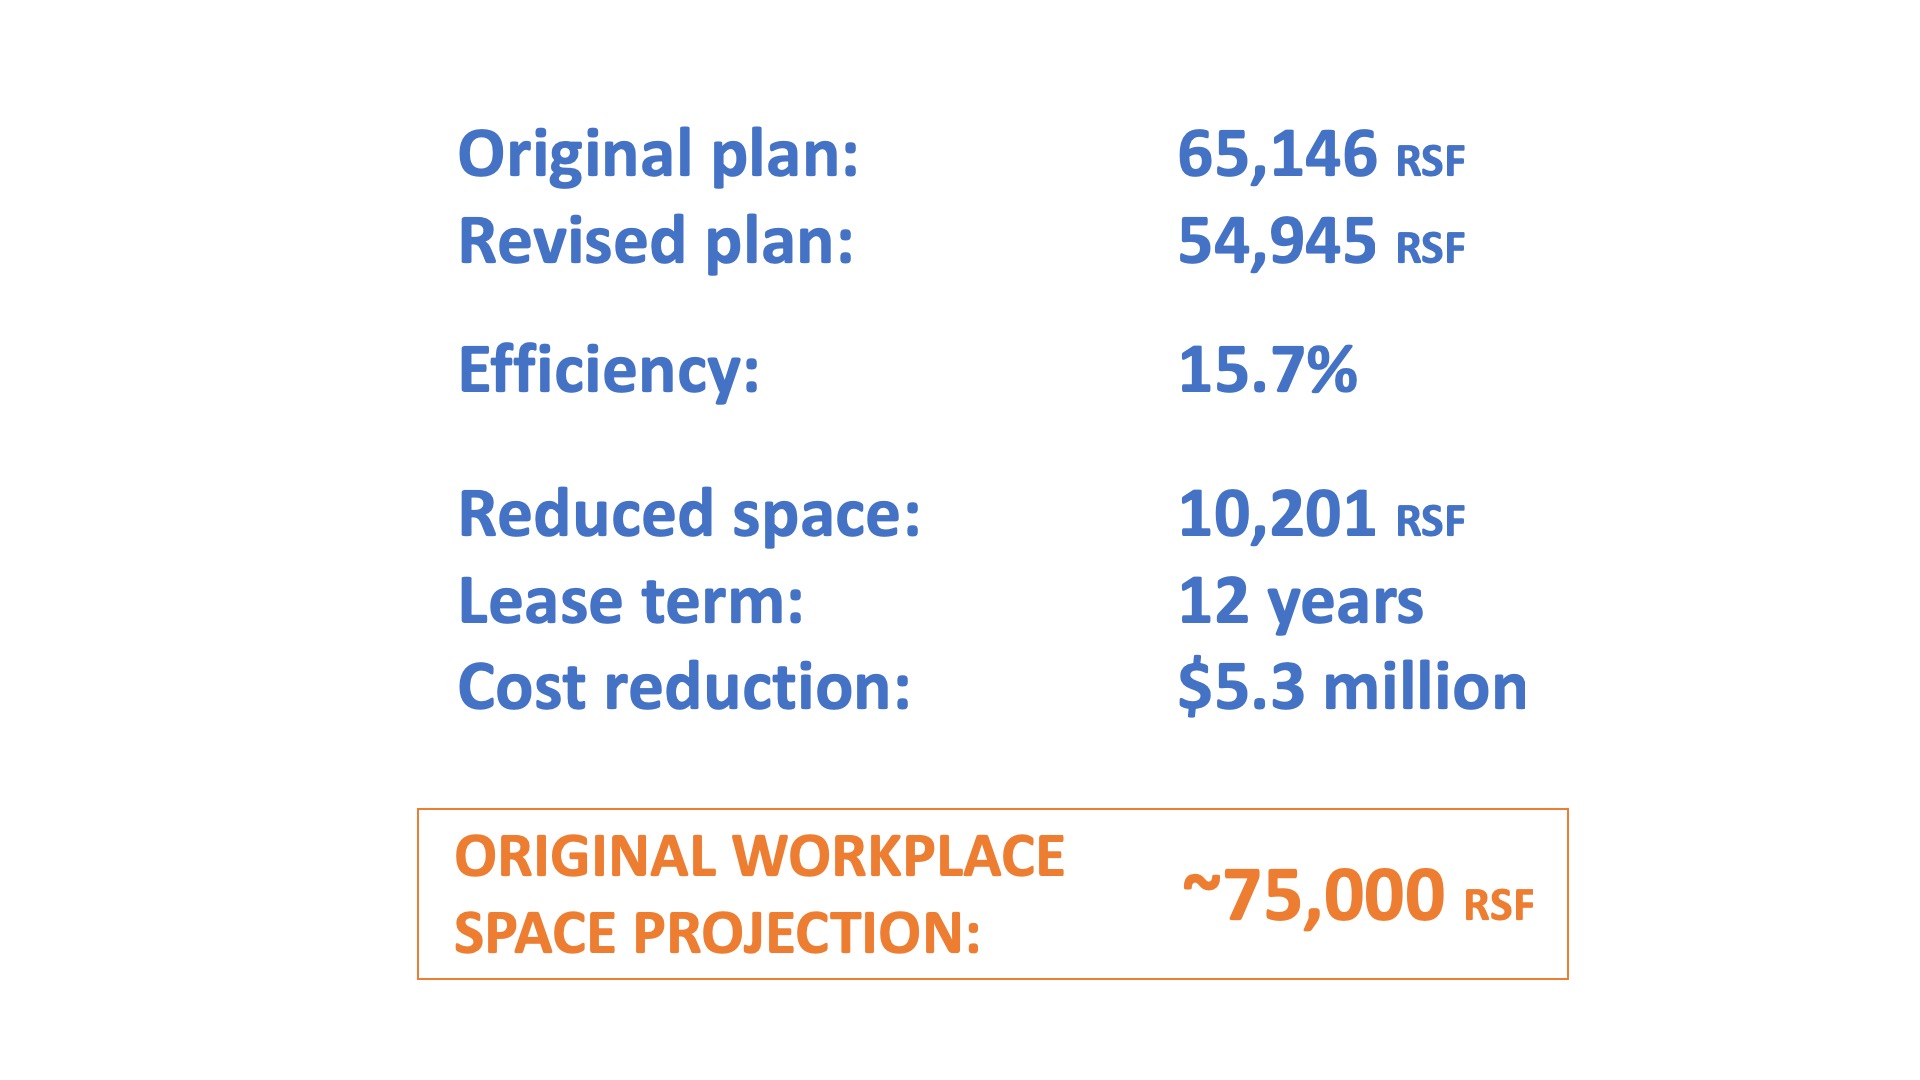
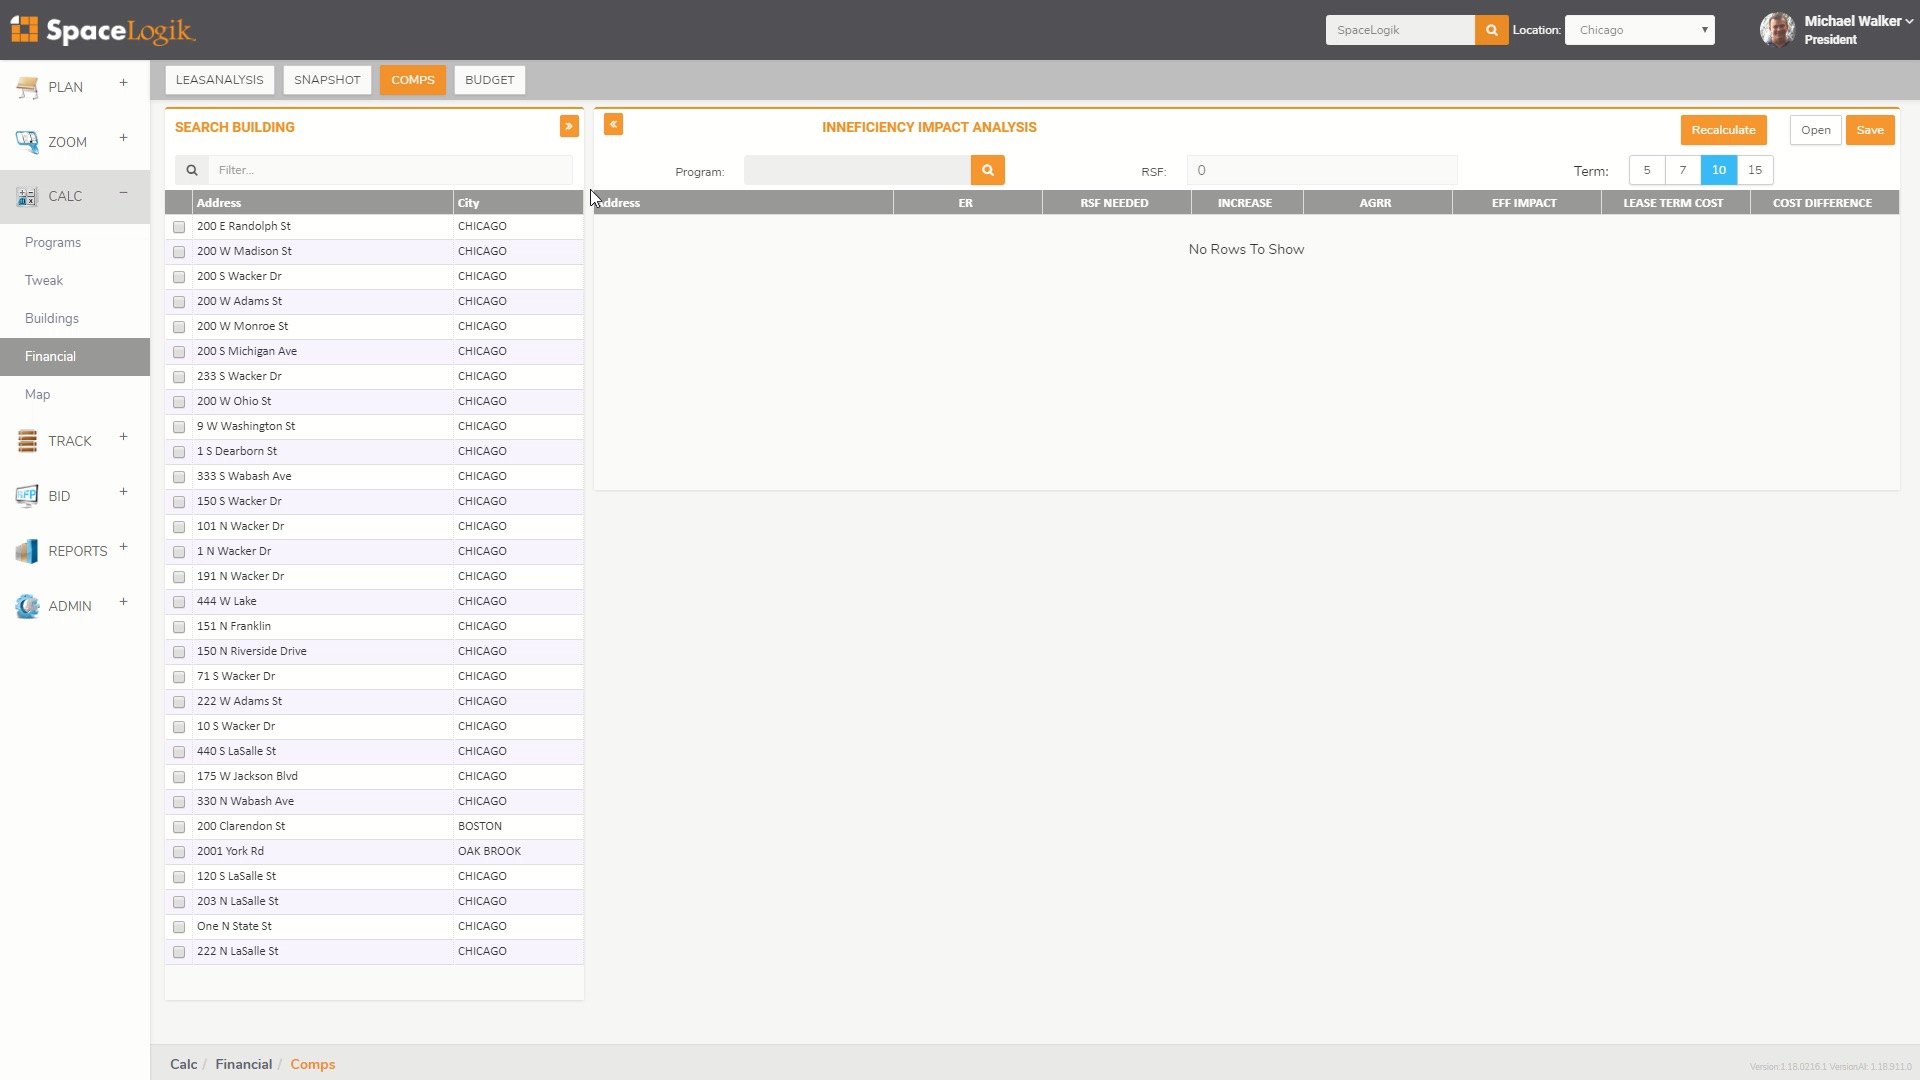
So I thought I'd show one example here of how this was put into play. This is a landlord in Chicago that sent us this two and a half floor plan for an insurance company and they had just been eliminated from a transaction and said we got cut because we need 65,000 square feet in our building and the competition only needs 60. Can you give us an answer to this. So we put the program into our software and came back to them in under an hour and told them that not only did they not need 65,000 feet or even 60 but that program should fit in 55,000 square feet. And they engaged us and we ended up drawing that plan. So the impact that this had on the transaction was pretty significant. So it's fifteen point seven percent reduce space by 10,000 square feet but it made a five point three million dollar impact on that tenants decision. They ultimately moved into this building.
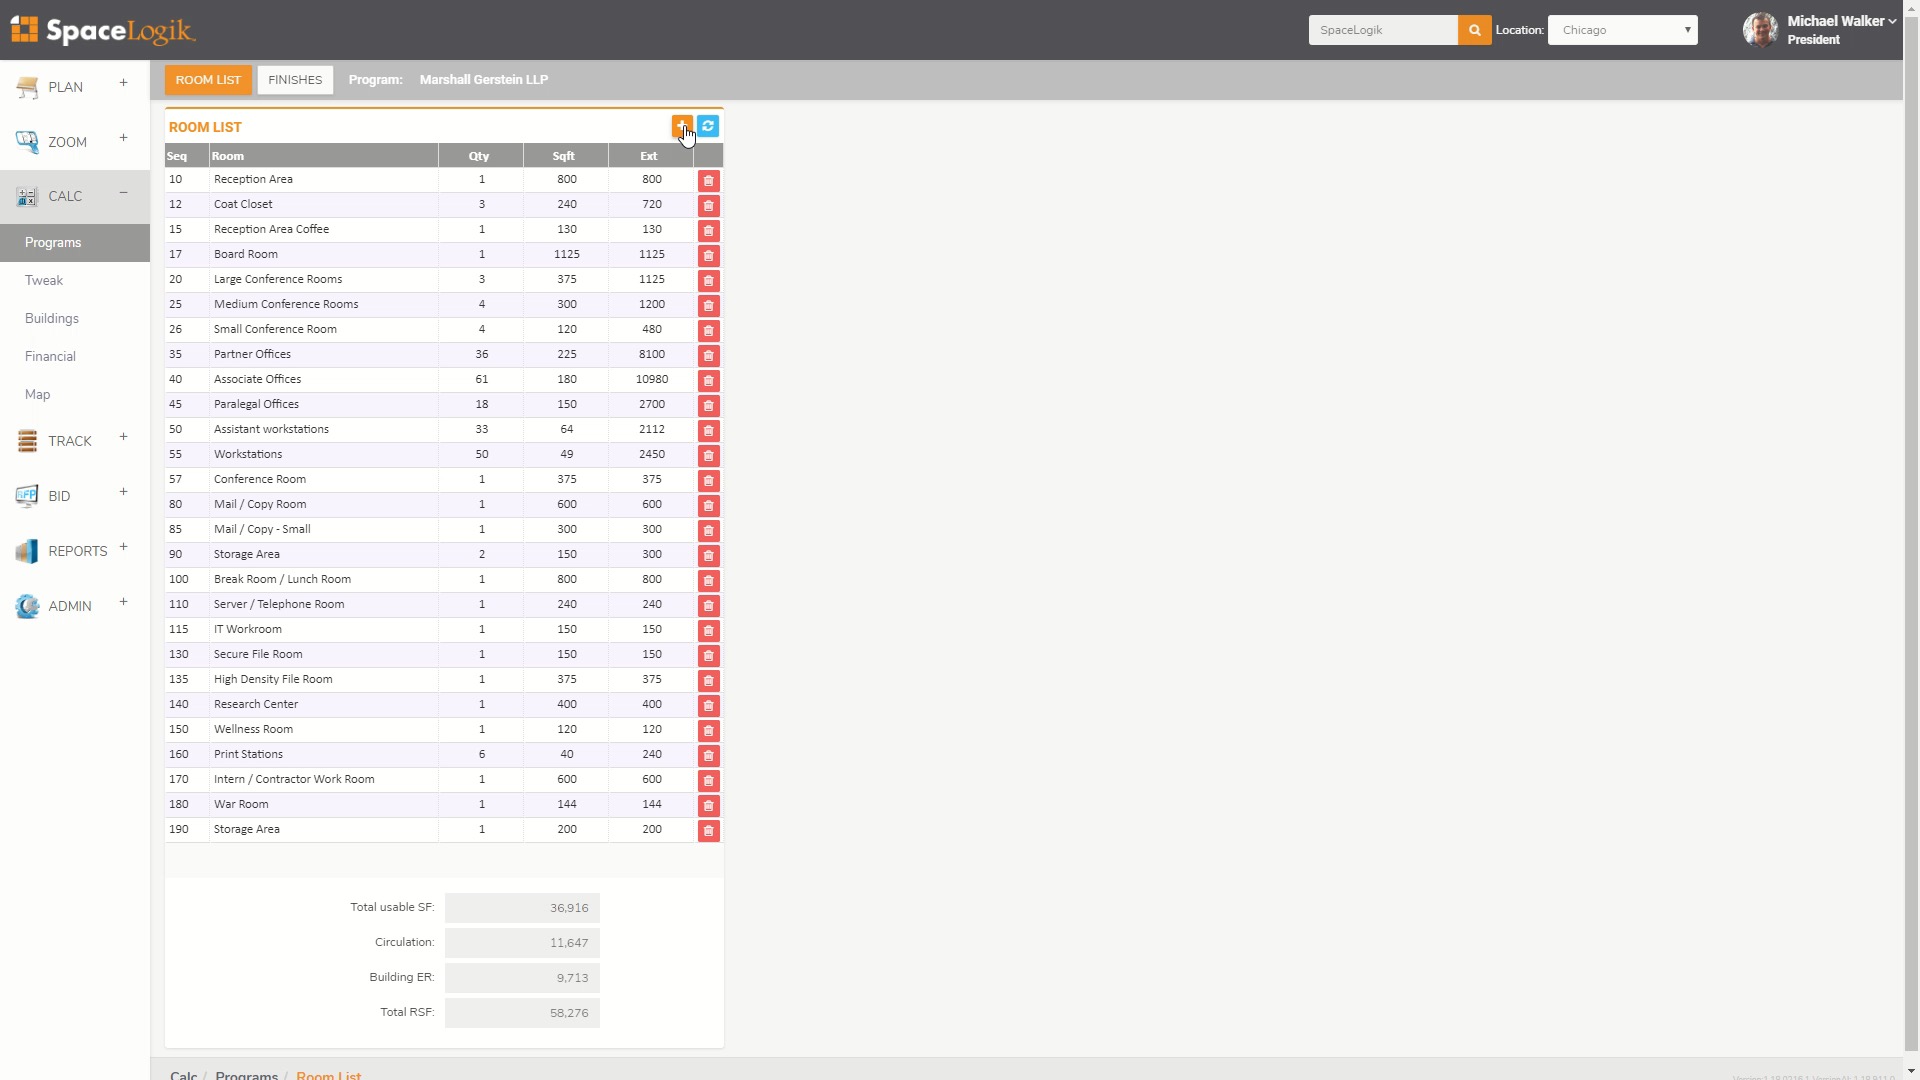
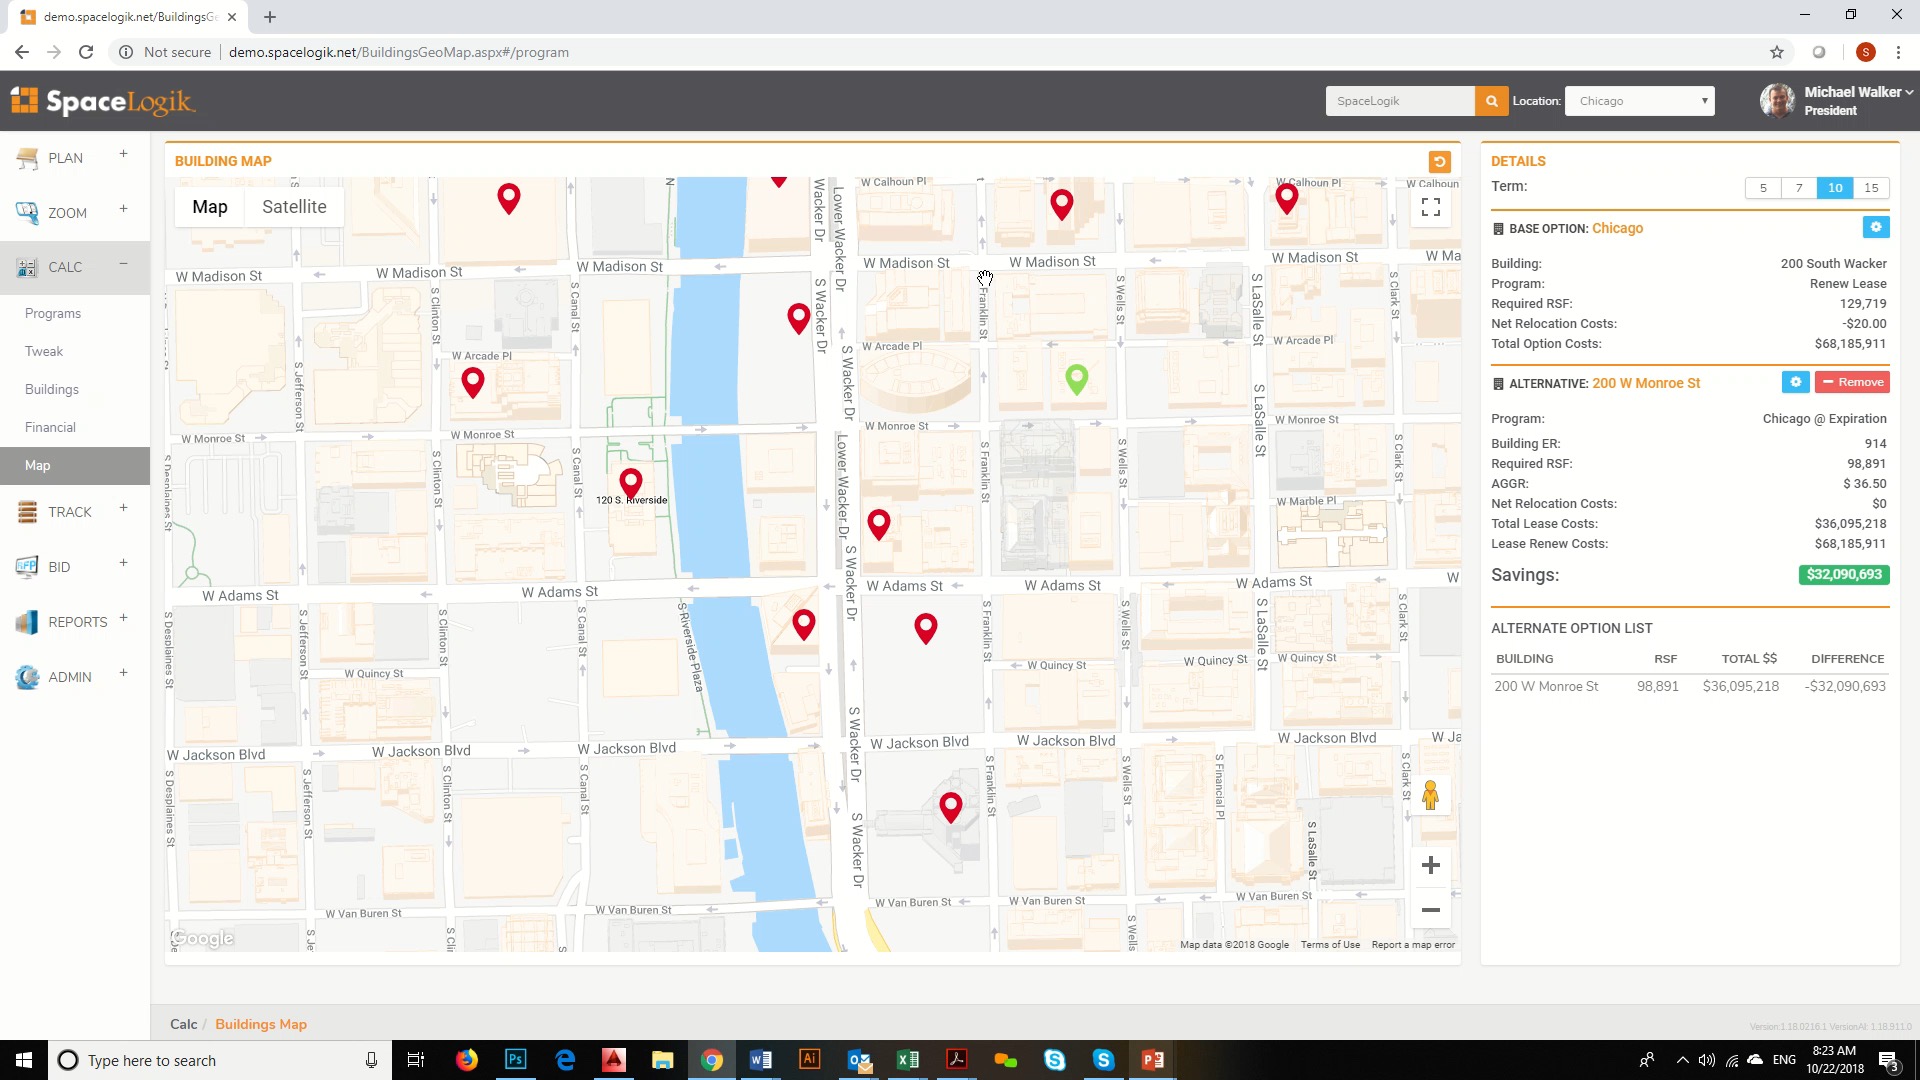
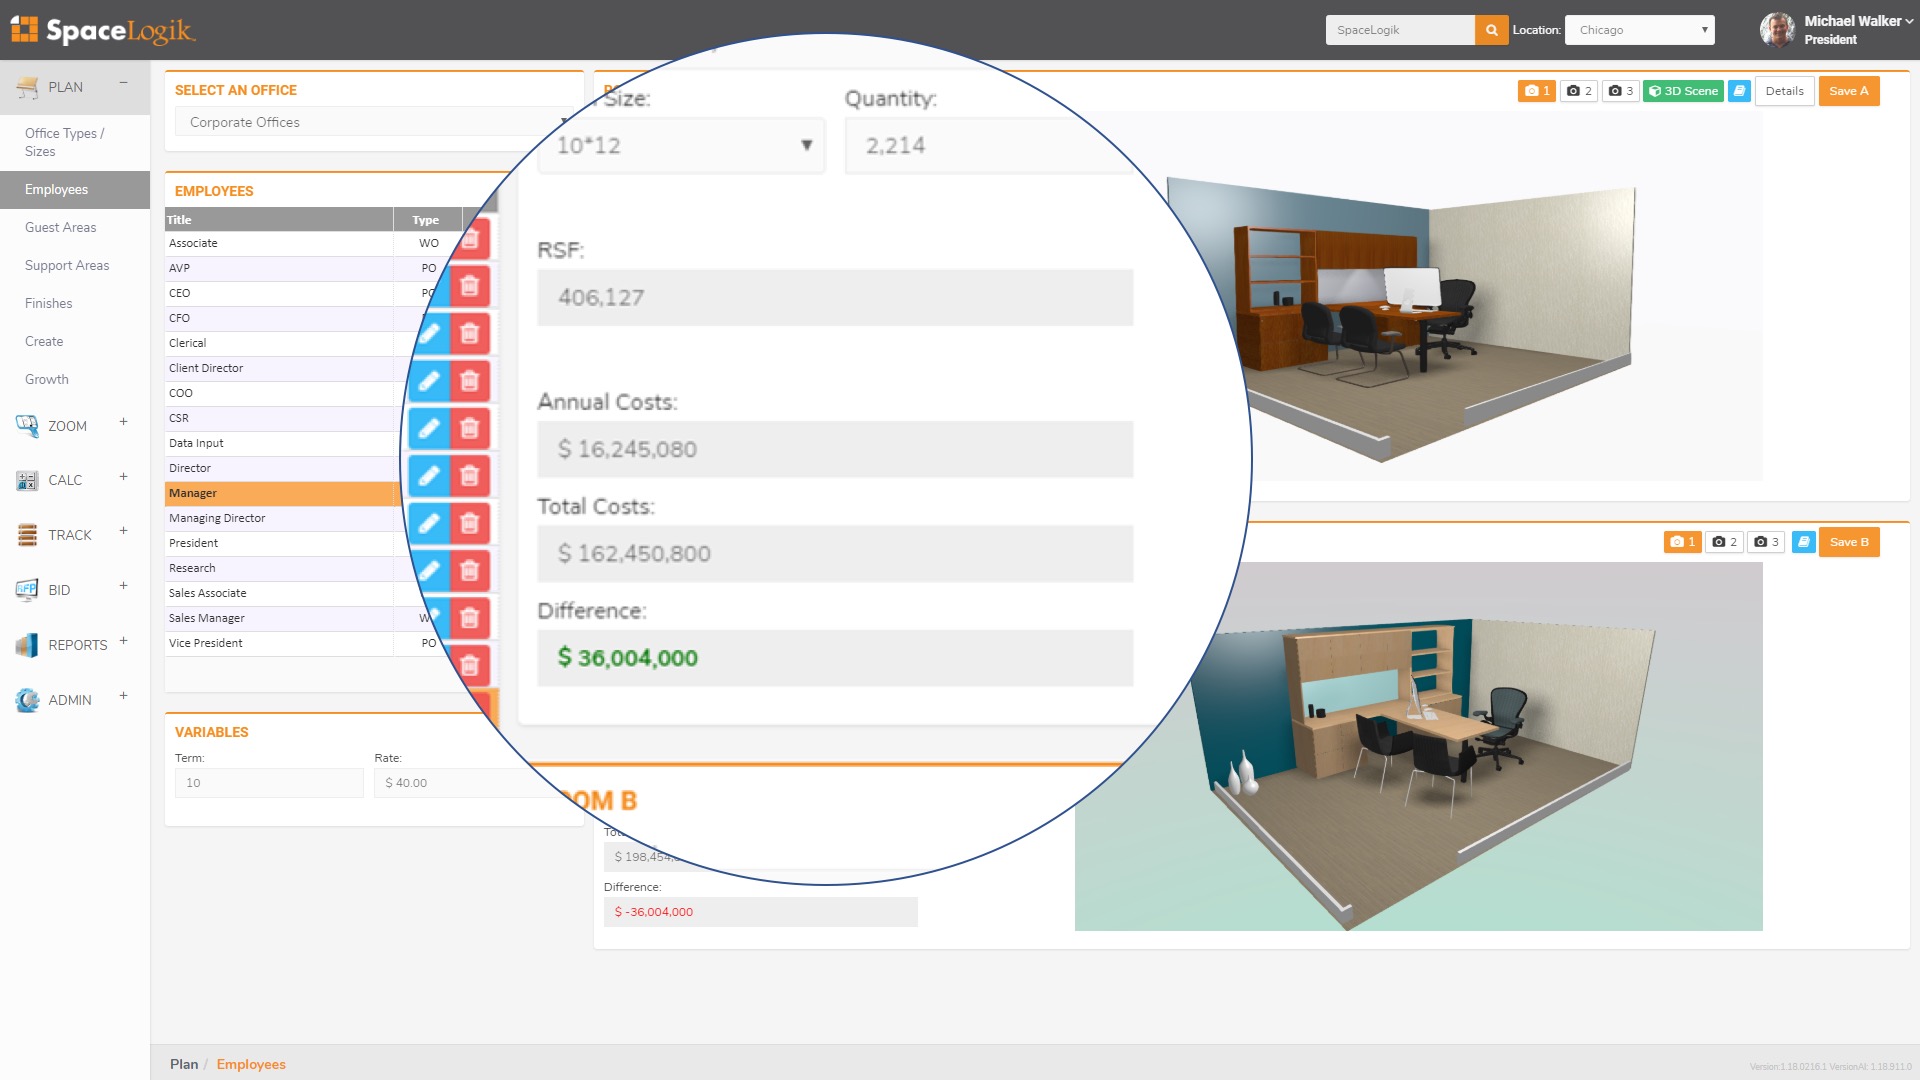
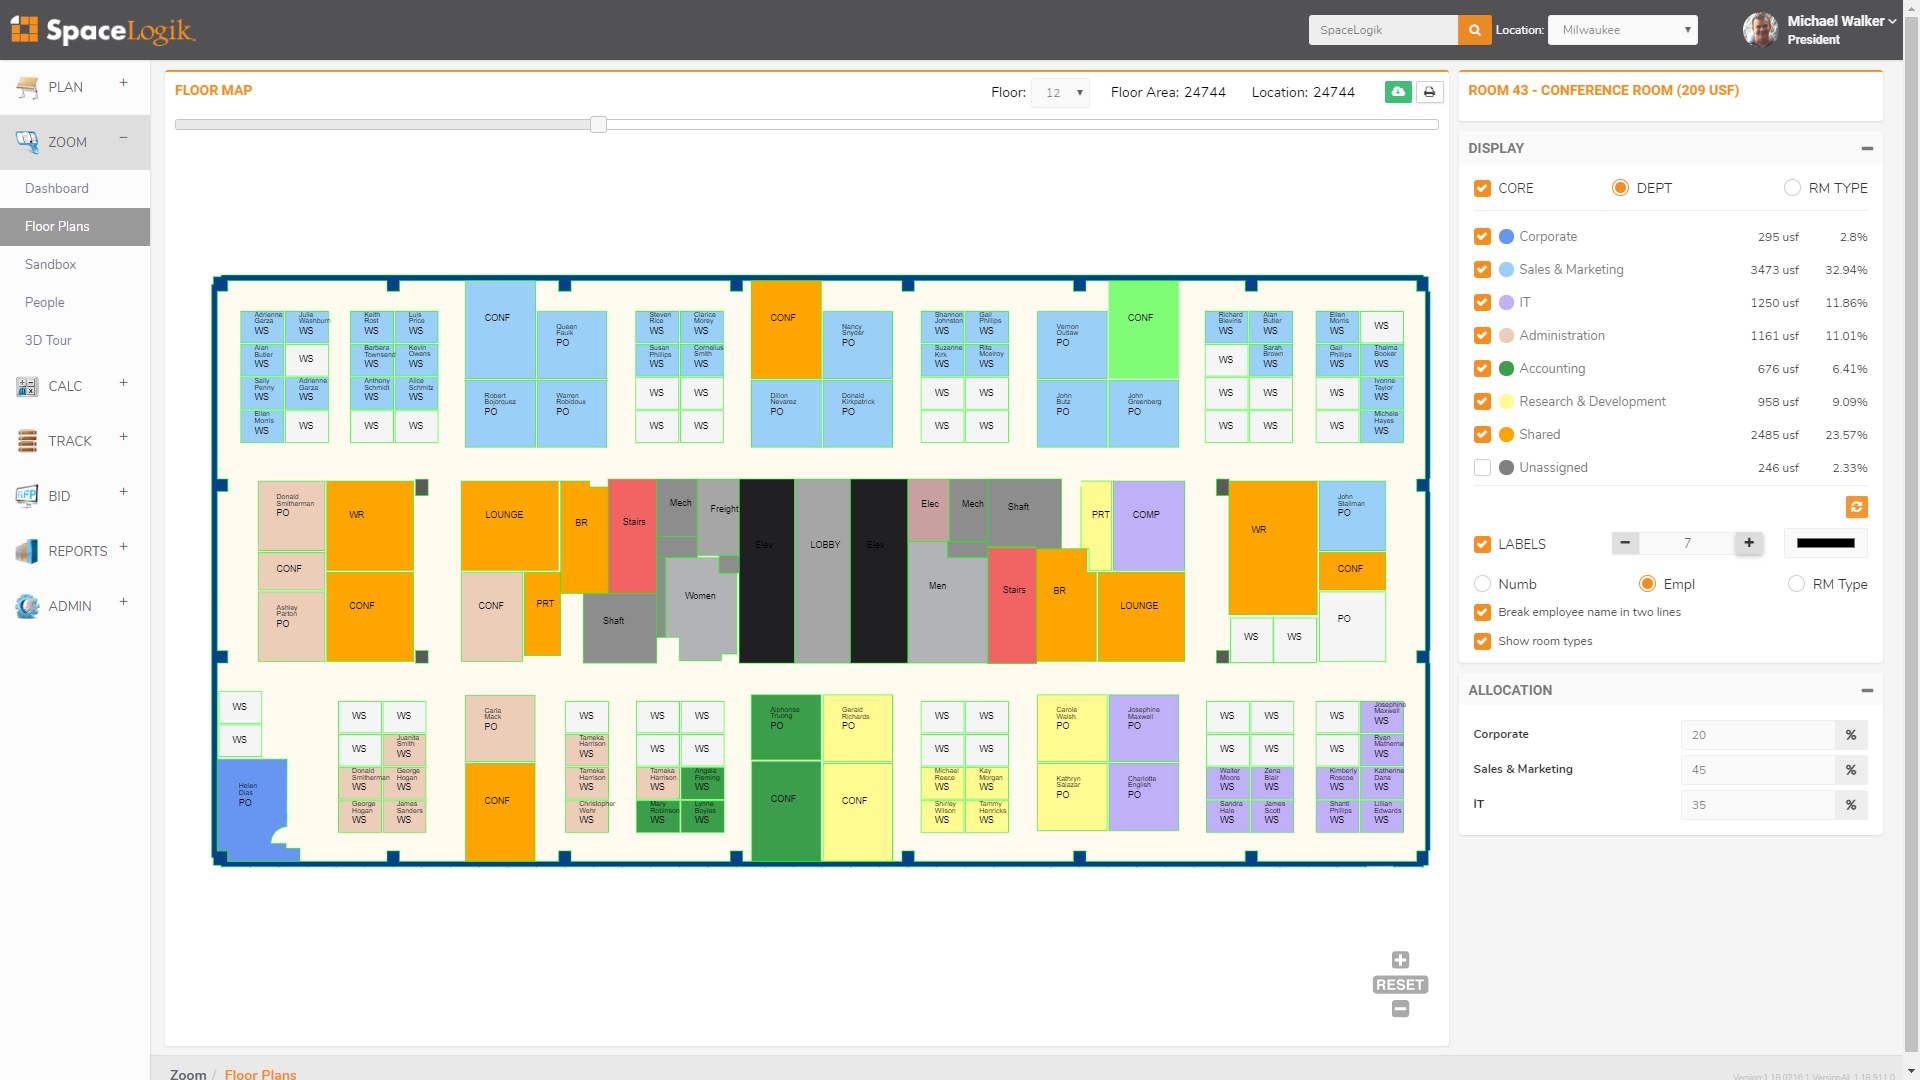
The ironic thing is that after the transaction was done we saw the original workplace projection of how much space this tenant needed, and they had told them that they needed 75,000 square feet. So when the architects came back at 60 and 65 they were actually heroes but there were still over sizing by 10 percent. So now we've taken those formulas and put them into technology that allows us to build their program in 45 minutes. And here we're adding 100 workstations to the program you can see you just save it and it adjusts the rentable square footage. And if we take a one step further we can line up that program now with any building or any number of buildings and instantly tell the tenant not only how much space they need in different buildings but project what they're either 10 year or 15 year lease costs are going to be. We can also put that on a map. So not only pair how much space is needed in that particular building but compare it to a database of available space in the market.
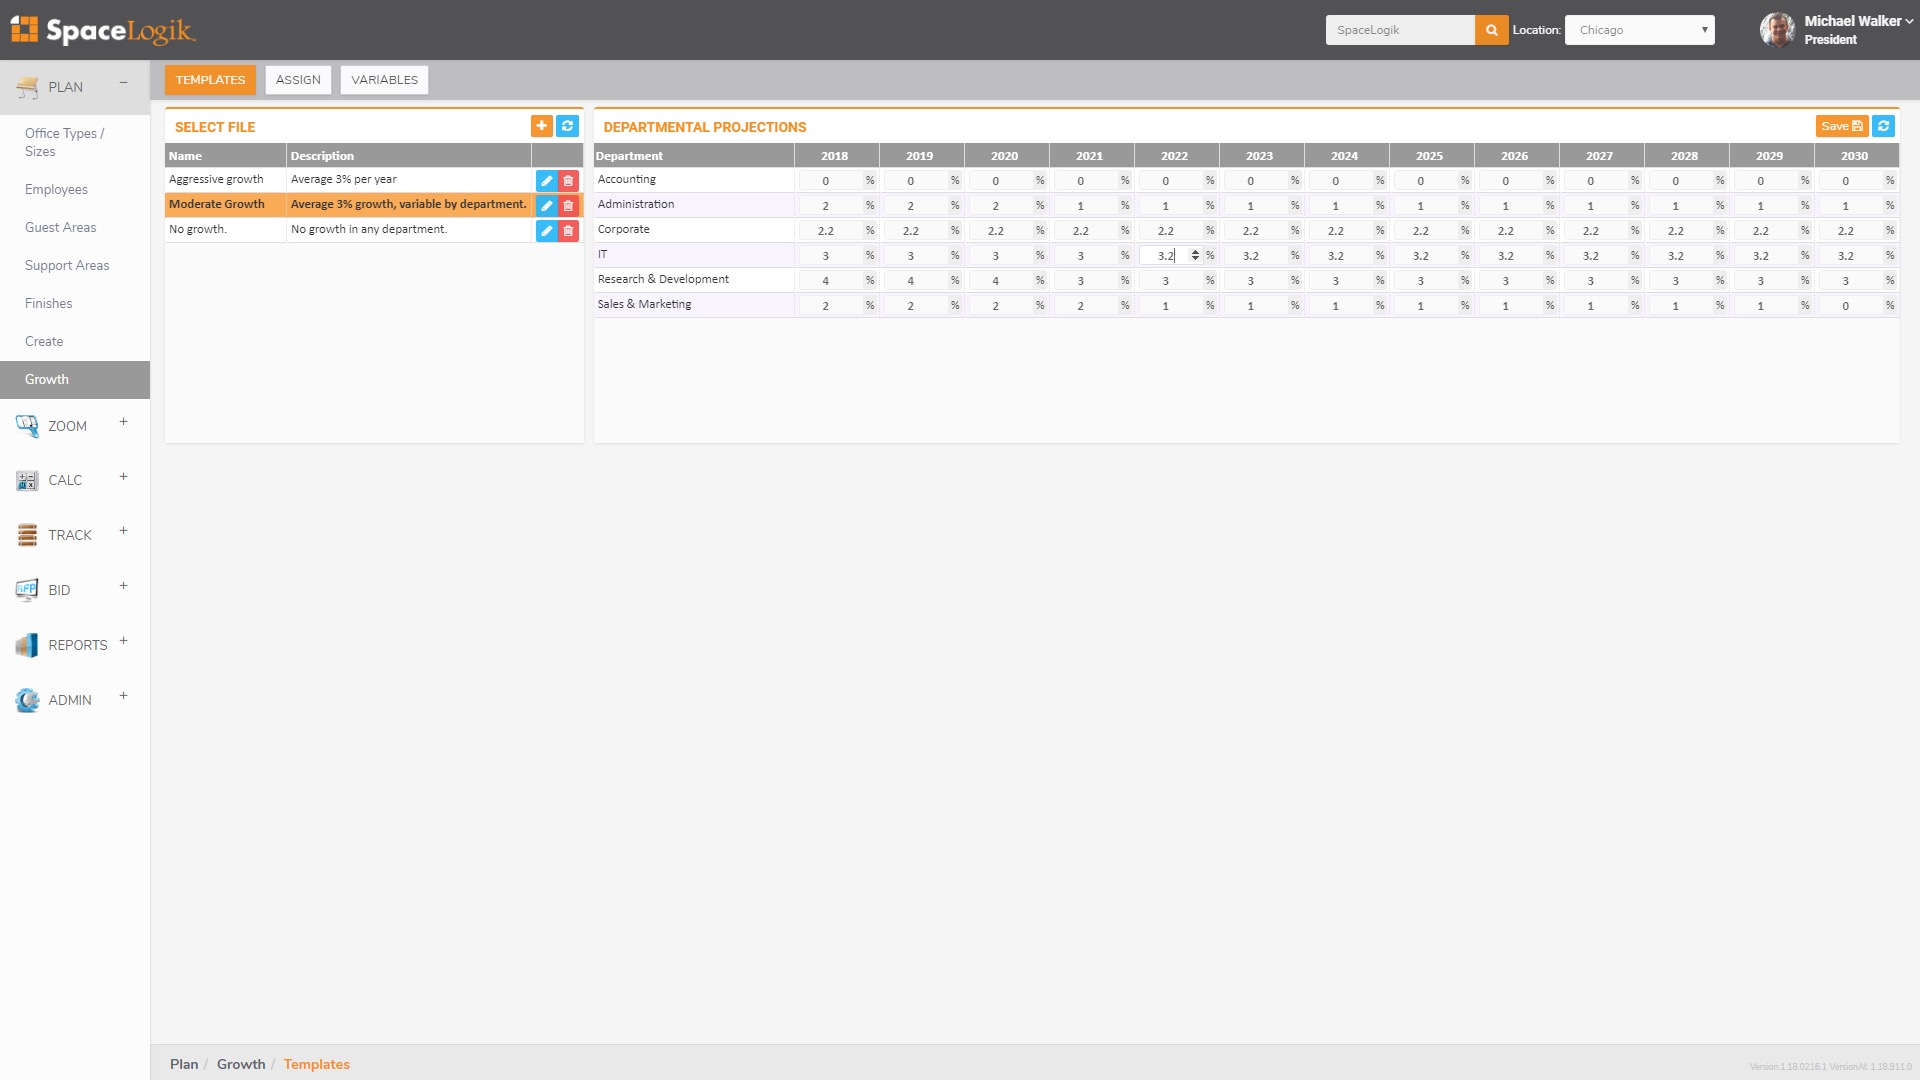
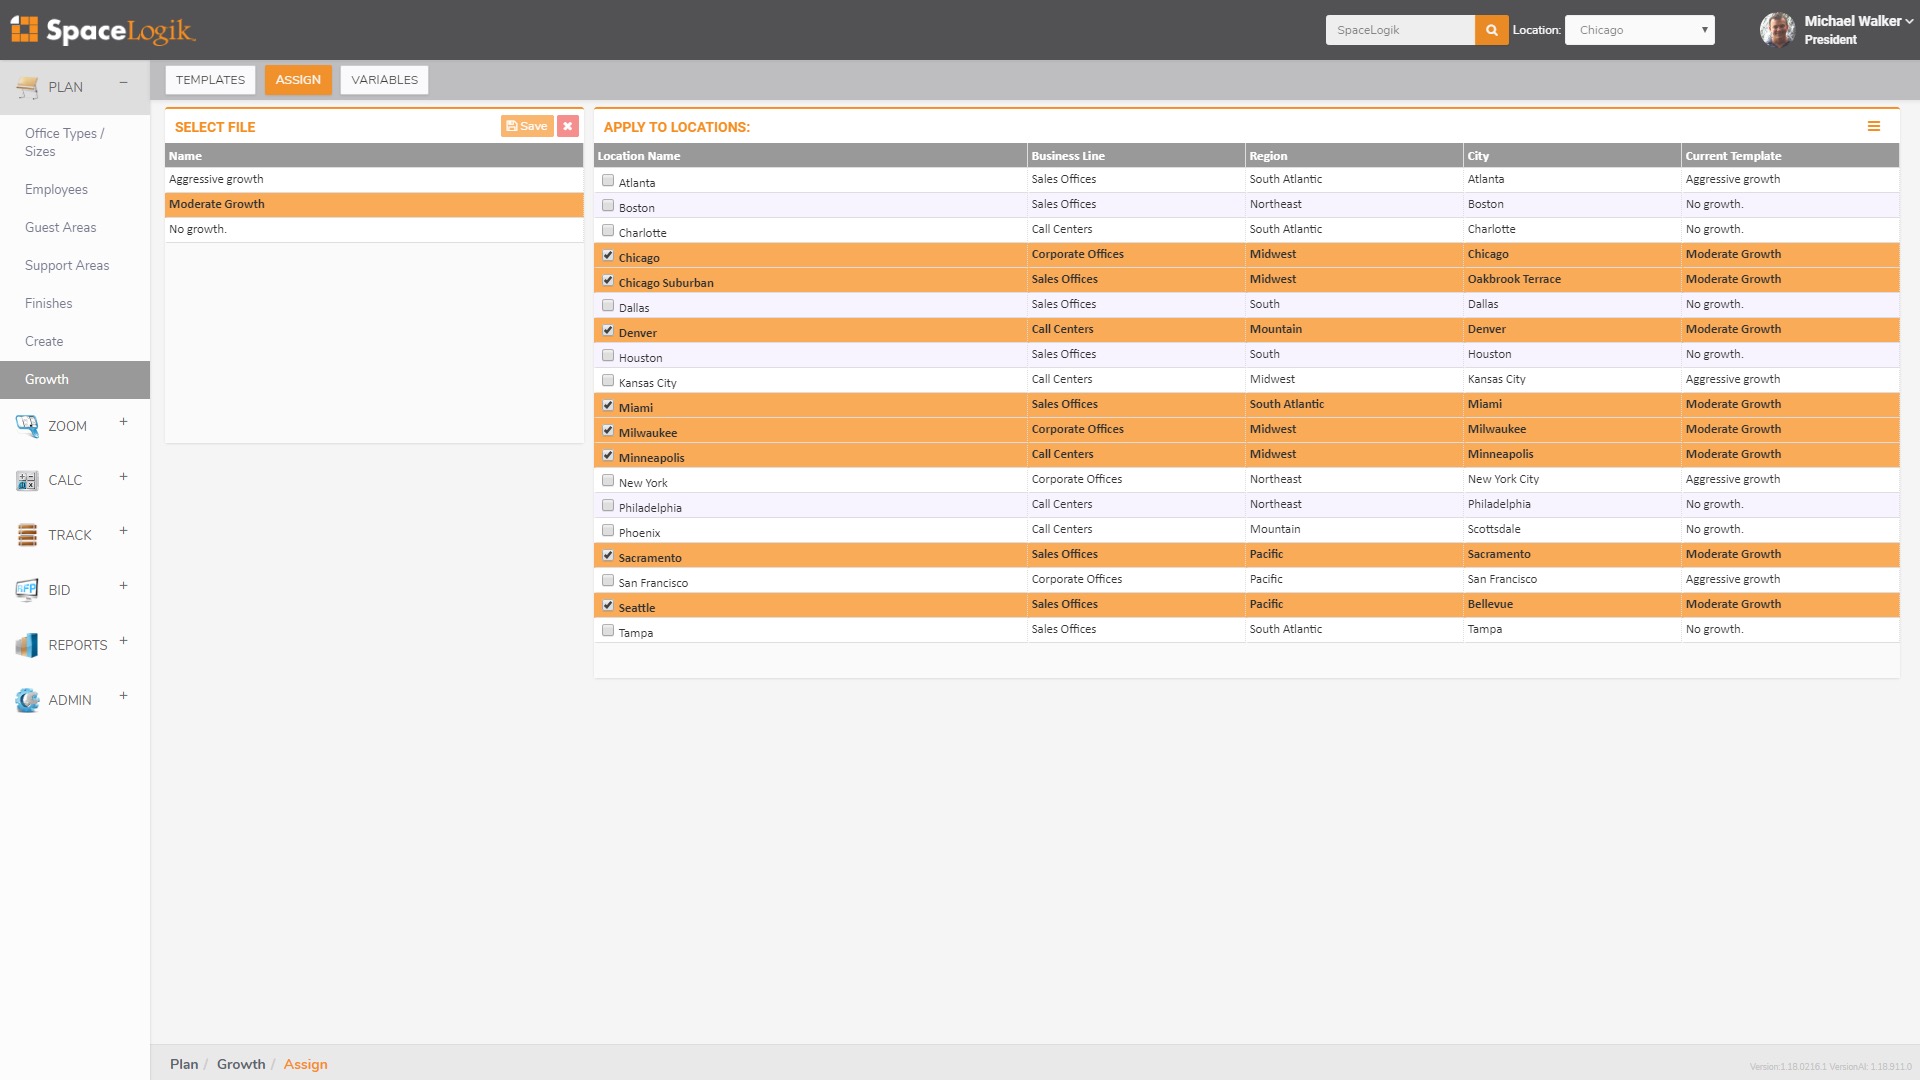
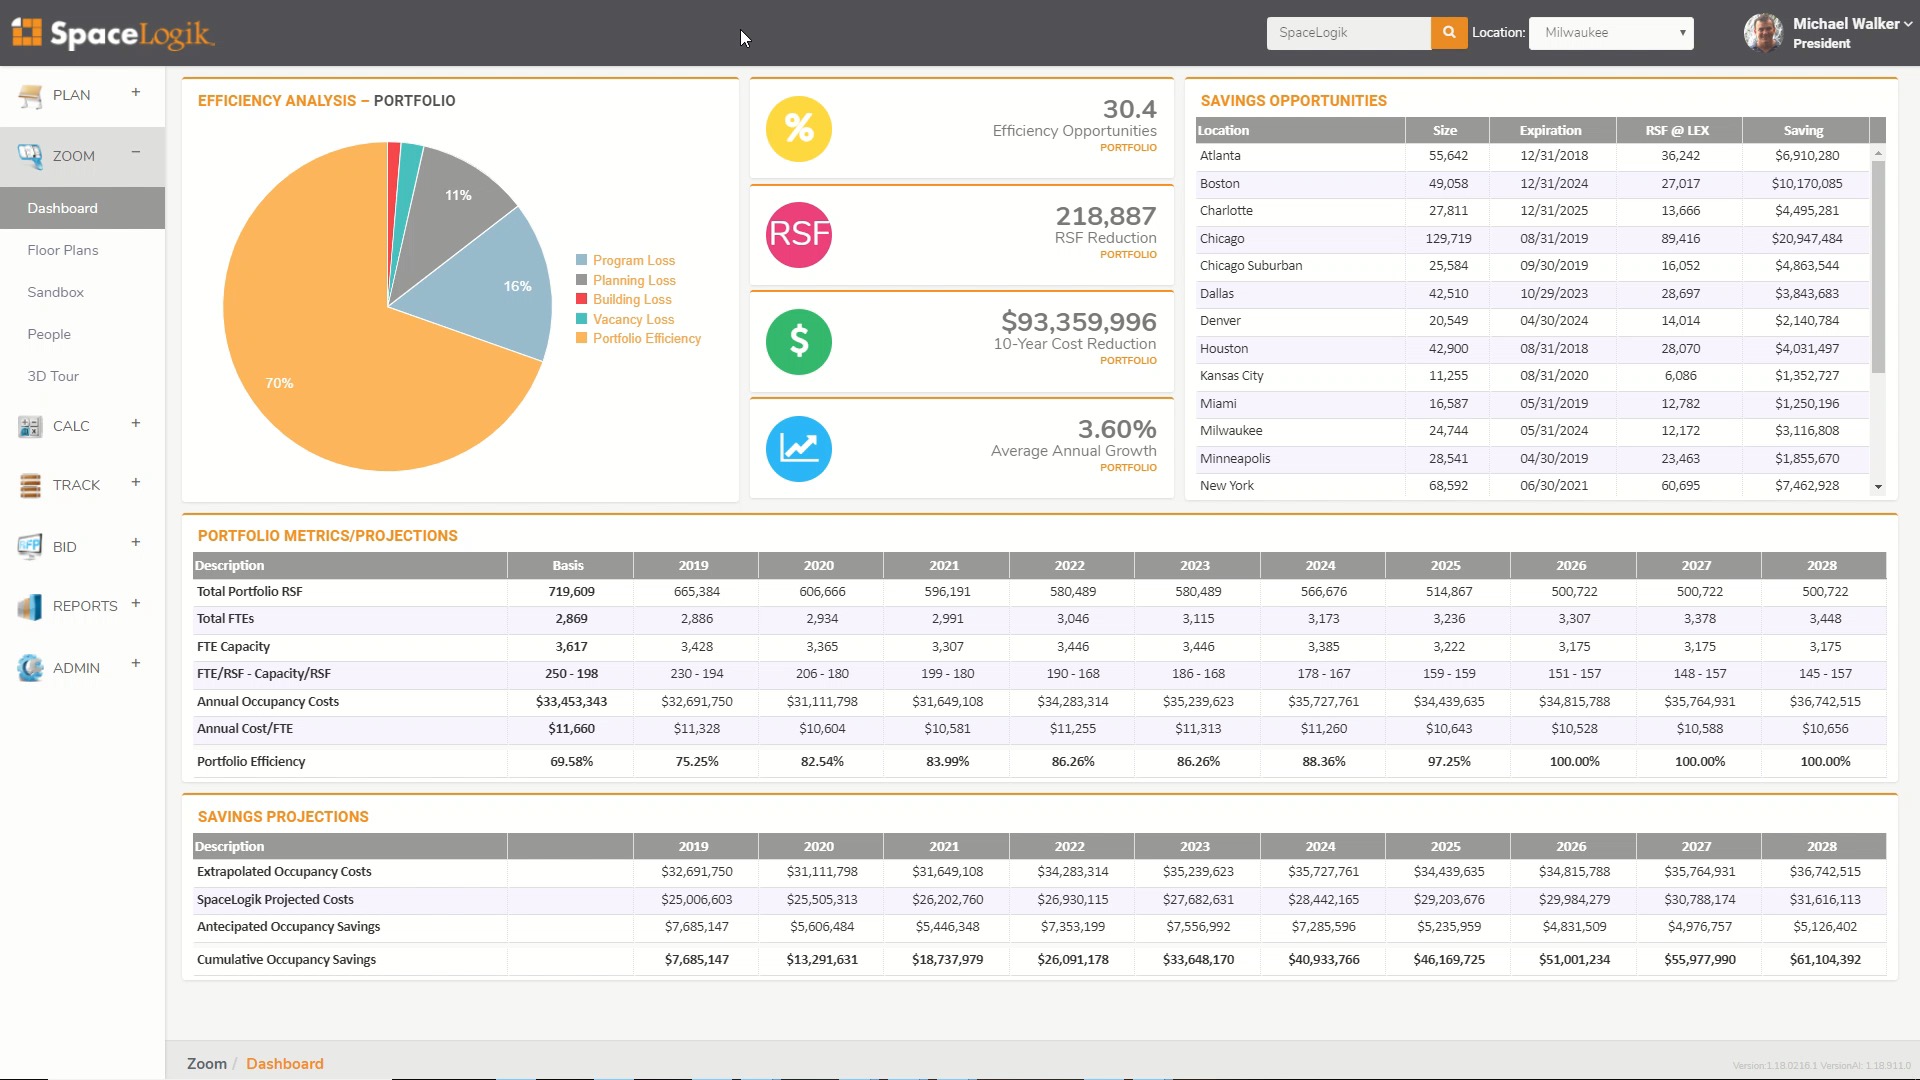
So you can instantly kind of pick buildings that have enough space, see how much space they need in that building and project 10 year costs. So we wanted to make this available and actually automate the process for larger corporate users. So we added a few other tools in the software. One is a electronic corporate standards. So what we can do is analyze the difference between different options. In this case they're looking at changing from a 10 x 15 office to a 10 x 12 office and across their portfolio that would have an impact of 36 million dollars over the next 10 years. We added a growth tool so you can build different templates and then apply those templates to either different office types, different regions and then a caf feature that does the traditional CAF from things like departmental cost allocation and vacancies. But what we're using it for is to take an inventory of the number of employees at that location. So now we can take these original formulas taking inventory of their space automatically anticipate the growth that they've got in their company and compare it to their corporate standards and allow them to see their entire portfolio efficiency where inefficiencies are coming from, how much space they're going to need at any location, and what those cost savings are going to be over the next whether it's 10 year 12, or 15 year period.
So I think there are a lot of applications here. And a lot of takeaways I think the best takeaway is that good things happen when you help your kids with their homework.
Thanks.