office

Kanav Dhir: Powering the Future of Real Estate - Transforming a Trillion Dollar Industry

vergesense image.001.jpeg

VIEW PRESENTATION:


kanav dhir.jpeg

Kanav Dhir, SVP of Product, Vergesense

WEBSITE | TWITTER | LINKEDIN


VIDEO TRANSCRIPT:


Good afternoon everyone I'm Kanav Dhir from vergesense. I'm a product manager here. I lead a lot of our product efforts in the hardware and software side and I'm gonna talk to you about how bird sense is helping solve a lot of the questions of today. We have of our spaces around how the spaces are being used and also preparing us to solve a lot of a question we're gonna have tomorrow 

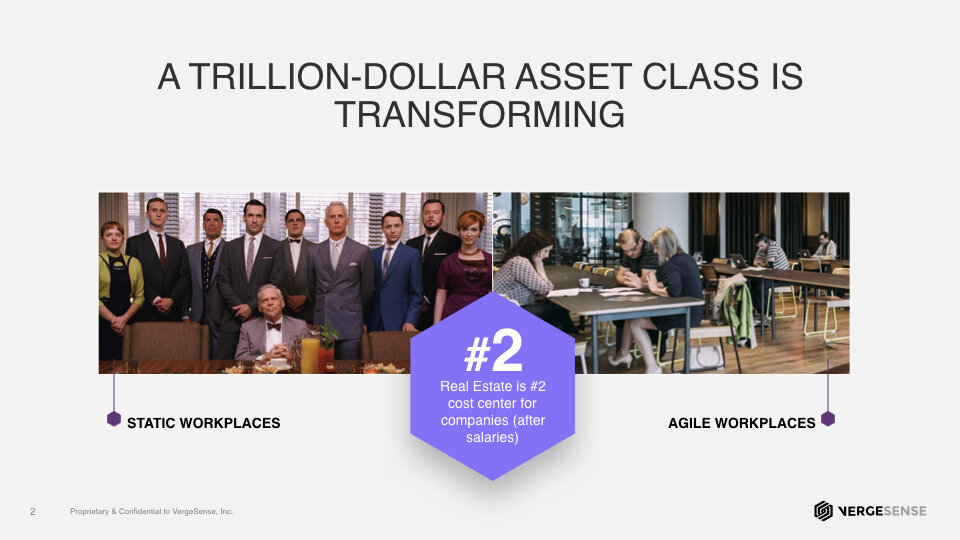
So we all know the transformation that's happening in our industry right. So there's a trillion dollar asset class. We have millions a square foot in our corporations and the way these real real estate is being used is completely changing. We have more dynamic workplaces it's not individual offices anymore. We're designing spaces to be used for interaction. And with all of these changes we need a way to understand how these spaces are being used 

there's some data that shows that with coworking spaces the day old 200 square foot per person is now going all the way down to 75 square foot per employee. There's a big change and we need to understand how it's being used and what can we do about it. 

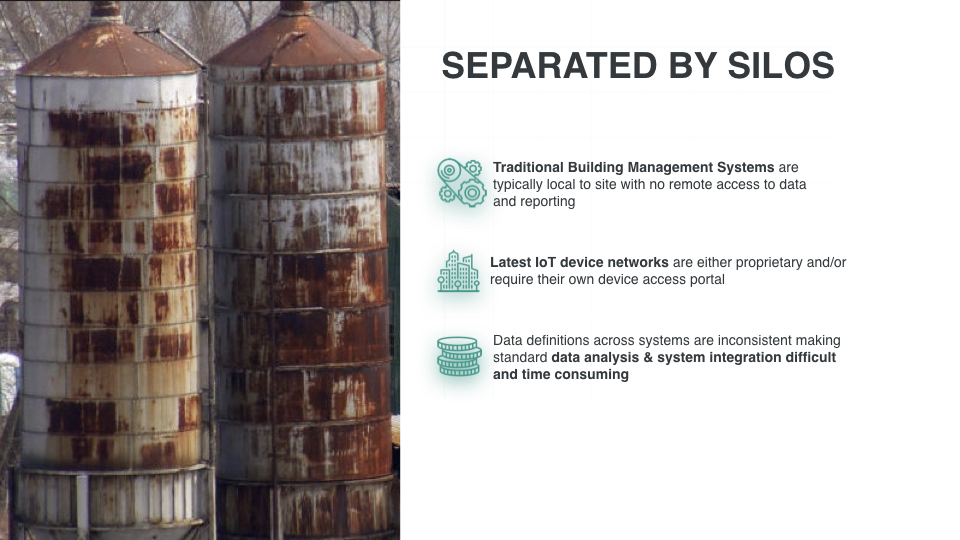
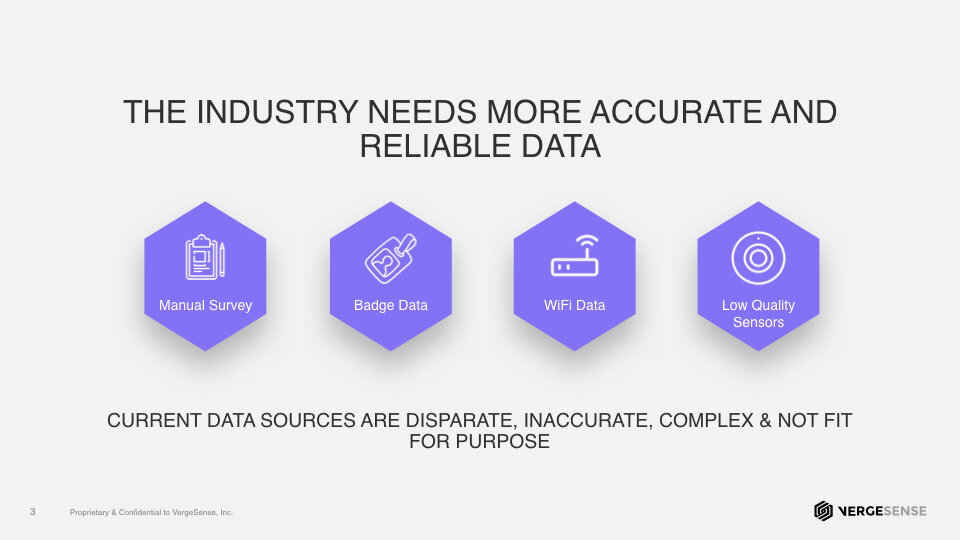
The industry has a problem it's a little bit of a mismatch in the slide here but there is a lot of different types of data sources available and they're disparate. They're complex they're not fit for purpose. We have manual surveys which are actually really insightful data but they're infrequent they're costly and we have a lot of companies spending a lot of money on Wi-Fi data badge data and they're trying to eat soup with a fork. They're just trying to understand how spaces are being used from data that's not meant for that. And then there's data that's related to low quality sensors. 

I'm trying to use sensor designed to turn on lights to understand how my space is actually being used 

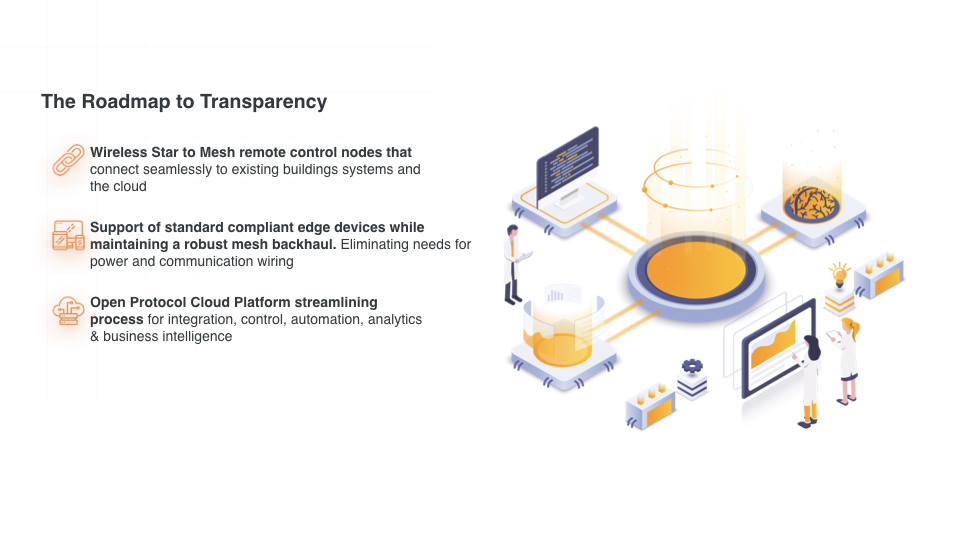
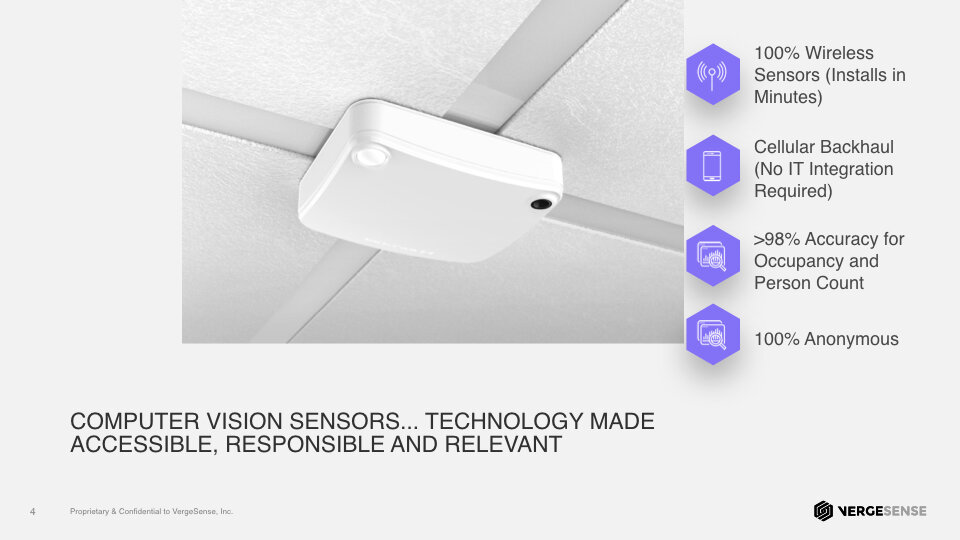
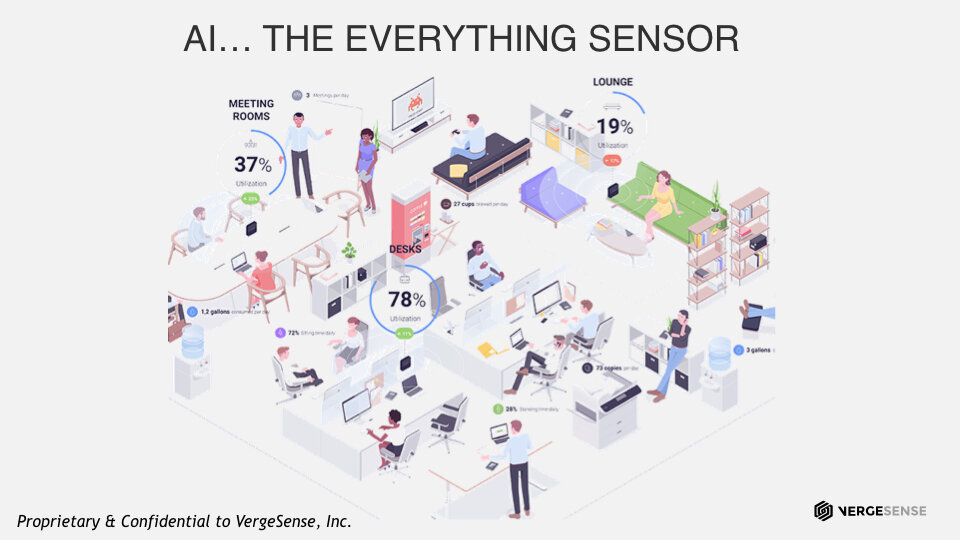
so advert since we're designing sensors that allow customers to get the power of computer vision. 

The technology has made accessible responsible and relevant for understanding how spaces are being used. This technology is 100 percent wireless. 

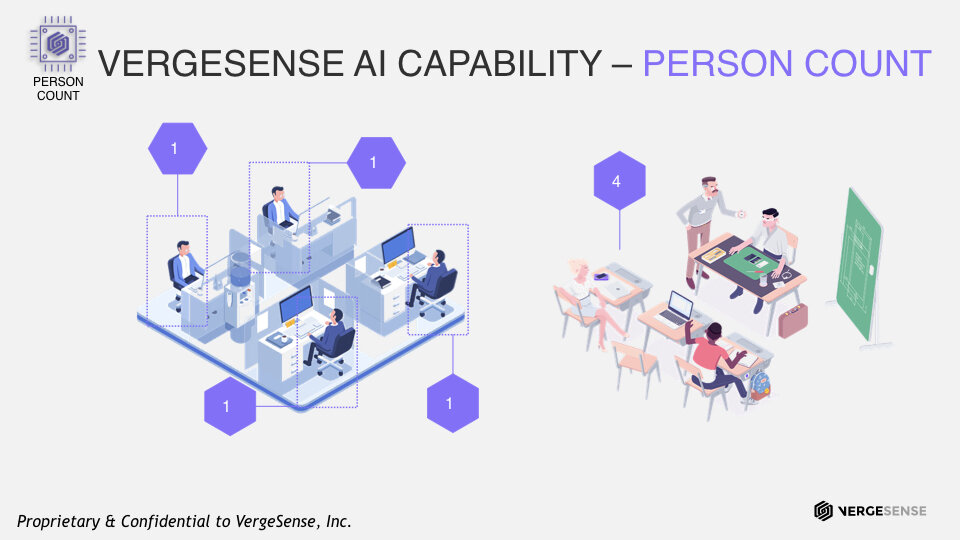
It can be deployed in minutes is a cellular backhaul so bringing low I.T. friction and the data itself is ninety eight nine 10 percent accurate and a hundred percent anonymous and we're able to do a lot more with it than we would think so versus the one of the main models that virtuous is deploy the main kind of value that we're bringing to customers around people counting so would the single sensor over a pot of desks and six to eight desks we're able to get not just occupancy but person count down to the desk level we're also able to deploy the same sensors in any space whether it's a soft seating area cafeteria lounge and we're able to get a person count for that space and even spatial awareness of where in that space people are 

that's just the beginning. 

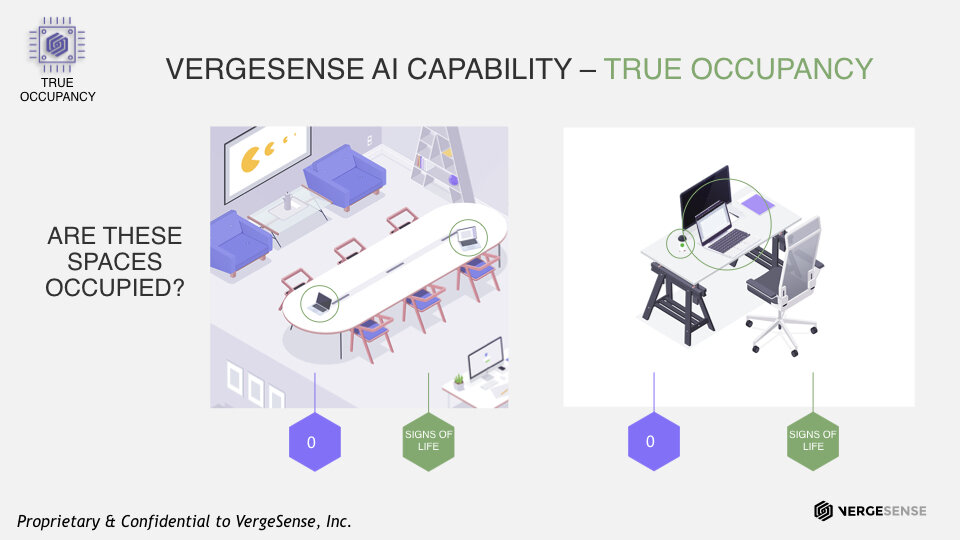
Here's an example of a new model that we deploy to the customer so a customer is using virtual sensors to understand how their space is being used for several several months and they actually brought in CBRE to do a manual survey during the time vertex was there and there was two purposes of this. One was to make sure Virgin's is working and we found that Vertex was actually with a double blind test 99 percent accurate. The other was to understand are there data usage that the data is not able to collect other things in the ways people are using the space that we're just not able to measure. 

And one really interesting insight that they found was 25 percent of desks and 10 percent of conference room usage was passive meaning no one was there but they're not available for people to use so with this customer with the same exact sensors they're using for personal count because they're powered by computer vision. We deployed a new model that allowed them to not just get a person count for space but also understand if their signs of life. So both from a historical analysis recycled back understand what percentage of usage is falling within this criteria so they can make behavioral changes but in a real time perspective for live addressing for real time understanding what's available they're able to not you know lose out on occupant experience by sending people to a place that may not have people in it but is still not available for them to use 

this is these are just some of the beginnings of what customers are able to do with our sensors we have customers that are working with us and figuring out for facilities use cases. Can you identify how messy a space is. How much has it changed so I can actually prioritize which spaces too and to not clean. Rather than having a cleaning service go out every single day. We have customers that are spending millions of dollars designing furniture and spaces designed for collaboration and they want to measure. Is it actually being useful or spending money on. So we're working with the customer to design a model that can actually put a collaboration score on these meetings these interactions are people interacting. 

Are they using the space for individual work. Should we be designing different types of spaces and then anything from customer occupants using spaces that are probably not designed to be used to making phone calls and even down to. Does the water jug need to be refilled. 

All that is possible 

with a I so I allows us to have the power of not just what we can detect today but be able to expand that possibility into what we're able to detect tomorrow. I want to share a couple of interesting data elements with you now that we have a lot of you know customers Fortune 1000 that have generated really valuable and accurate person account data 

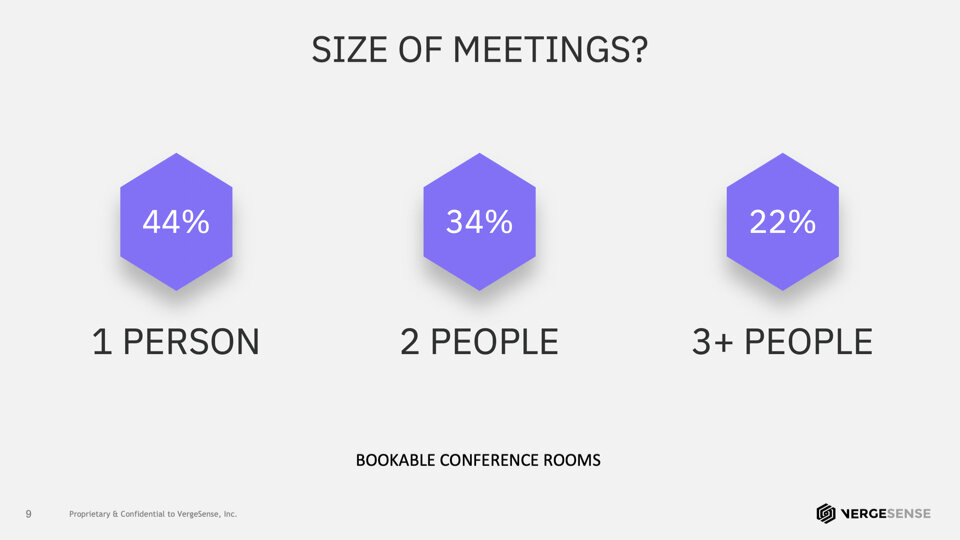
so across these companies these 10 companies you know Grant six months of data we polled 44 percent of meetings or one person meetings regardless it's conference room size 34 percent of meetings were two person meetings and only 22 percent of the meetings that we saw were three people or more. We all know there is a right sizing problem but being able to quantify it and attack it from actually how big the problem is it is pretty important data. We also do the same thing and understood a new trend of space which is unbreakable conference rooms. 

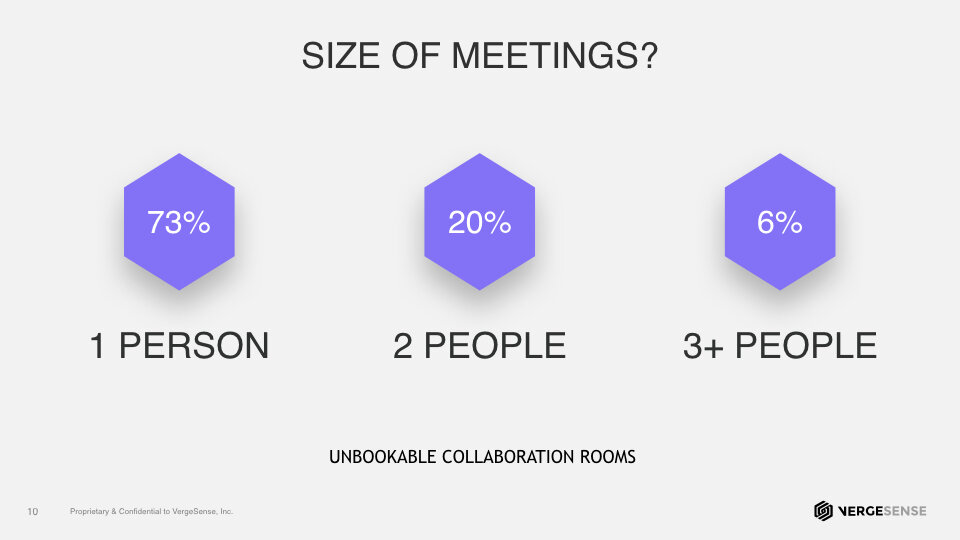
How are these performing so we found that you know unbreakable conference rooms collaboration rooms essentially are being used 73 percent of time by one person 20 percent of the time by two people and 6 percent of the time at 3 or more people. This is very insightful because while unbreakable spaces are significantly higher utilized than about conference rooms because you don't have ghost meetings you know squatters what you have to do is you have to design the space to account for the types of usage of these spaces they should have less square footage allocated to them because this is how architecture using it 

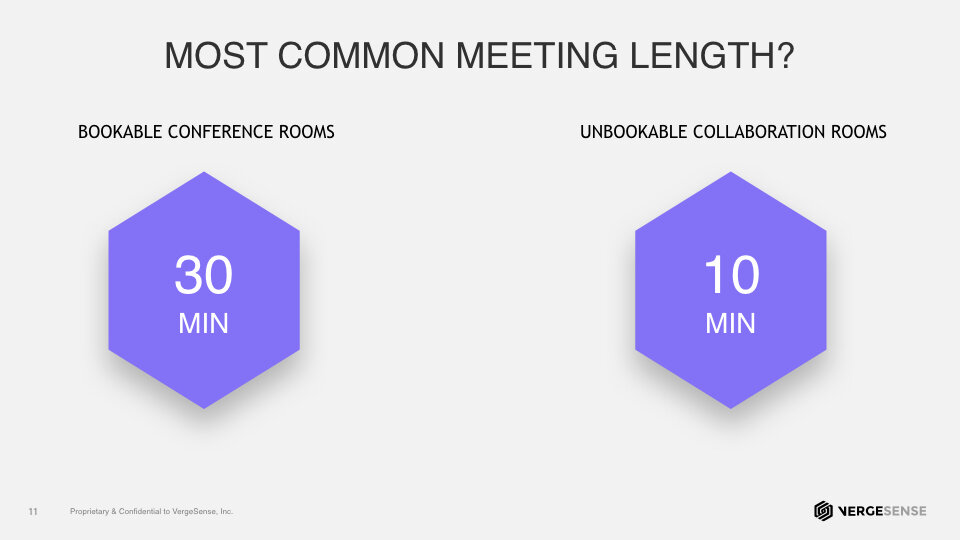
there's some very interesting data that we're starting to pull and see this. I actually found this to be pretty interesting for Book of confidence. We found that the most common meeting size is 30 minutes. And this is you know a lot along the lines of what you'd expect but for unworkable conference rooms because we're measuring person count and actually have this data reliable data. We saw that meetings were 10 minutes long most common. So maybe we should be using this design for better more comfortable furniture for short stays for poor standing meetings etc. 

So the last thing I'll leave you with is with the power of computer vision we're not only able to answer your question of today which is how our space is being utilized what are people doing. What is the experience how can we improve it but you can invest in an appreciating asset instead of a depreciating hardware device that can actually answer your questions tomorrow. Thank you 


Sean Fitzpatrick: Faster, Smarter, Easier - A New Era in CRE Valuation & Underwriting

Faster, smarter, easier.001.jpeg

CRE is evolving and technology needs to evolve with it. Coupling years of experience consulting for commercial real estate decision makers with technological know-how, rSquaredCRE launches to tackle advancement in CRE valuation and underwriting.

Filmed in Partnership with Realcomm | IBcon


VIEW PRESENTATION:


SF.jpeg

Sean Fitzpatrick, CTO, rSquaredCRE

WEBSITE | TWITTER | LINKEDIN


VIDEO TRANSCRIPT:

So CRE is evolving and what we've found is while our industry is rapidly evolving the technology hasn't quite kept up pace. In particular we're expected to close acquisitions now and half the time that we previously did but our software isn't keeping up with the task. 


So valuation software in particular hasn't met our expectations. We're still using desktop software, we're using software that was built over a decade ago. And while that's okay it's not going to get us to the efficiency that we need to be as an industry. So things like multi day training sessions to get you up on your valuation software. We think this is really a symptom not a solution. It should take you an hour, two hours tops to get you up on your your CRE software. 

So we're going to show you a solution here in a moment that hopefully will solve some of those problems. 

Our company our squared CRE is a brand new company but we're based out of an original consulting company. We've had hundreds of years of experience producing software. We have two existing software applications right now, our abstract and our budget that our SAS software applications in use for over a decade. So we're not new to this game where we're very much in a technology leader. We've got wonderful very popular clients, clients like Hines, EOP, Griffin Capital, First Capital to name just a few. 

These clients have reaped the benefit of our experience are hundreds of thousands of hours of modeling commercial real estate software. So we used our experience our frustrations that we found in modeling software to come up with a new solution a solution we think that the industry will greatly benefit with.

Here's our mission statement. So we're of course all about empowering CRE. We feel that our solutions will allow the industry to grow more quickly to have less friction and to get what we all need to get done which is valuations more efficiently processed.  So what do you need? What is absolutely necessary to solve this problem? Your solutions have to be SAS based. There's zero cost of ownership as it relates to owning hardware. So your TCO is going to be lower. You don't have to make those commitments, there's no sequel server upgrades. This is what is required for 2019. We cannot be using desktop software. We can't use software that you have to be at your office to actually be able to use it. You've got a SAS solution. All you need is a browser, ubiquity anywhere you have a browser. You're going to be able to use our application.

So again if you've got to spend time training people, if people have to guess what it means in a particular field you're going to introduce errors, you're going to have problems. So our application is intuitive. We have something we call an input carousel so you don't see hundreds of columns, you have to studiously scroll through the input carousel shows you just the field you need to see and just the areas you need to see them. So you're going to realize a much more efficient more intuitive interface. The UI feels kind of like a rich desktop application but you're in a browser so you get all that benefit of the rich desktop but you're in a browser environment and fast.

So we've got all sorts of hooks in the application. We've got hotkeys, so hotkeys to navigate to different places quickly hotkeys to add things to delete things. In addition to our hotkeys we have things called walkthroughs. So we can walk you through common things so you'll find in the application that we can get the data calculated the data in and the data out in the most efficient fashion.

So one knock on a lot of the incumbent software is that they're just pretty close environments and we built this with an open environment we want you to get your data into and out of our application with no friction. We have what we call round tripping of Excel so you can export your data manipulated in excel and return it. And while that's helpful for a single asset if you have hundreds of assets this can be a huge time saver. Take inflation for two dozen buildings change it in one place upload it simultaneously. 

There's a lot of benefits of being open. And we also open in the ability to consume data from other applications out there. So we've got a very robust VTS integration. We can import deal data from VTS we can import portfolio information from VTS we have links to legacy software. So we wanted to be as inclusive as possible to gain as much traction as possible our application is available for third gate trial for free. We don't want anybody to not have the opportunity to try to use the software. While you're using it, you have the ability to create snapshots. These are little things you can email anybody else or you can share the snapshots via our own email links. So you can send out to as many people as you want and get them up and running on the application.

So obviously everybody wants to use a DCF application that's accurate and it's something you'd expect. We try to bring it home further by giving you the ability to see all of your reports in excel. So these are not just CSV exports of data. This is formulas, these are presentation quality reports and that ability to vet them in excel guarantees the accuracy. 

Finally we need things to be transparent, so you can look at that formula, we have wonderful audit reports. A lot of times things like recoveries become black boxes you don't understand how the numbers came to be. When you see the formulas you can confirm to yourself that the application is doing precisely what you want. 


Collaborative. So we've got this in the cloud SAS application. We can have multiple users simultaneously editing the same property, they can be editing the same property, they can be running reports, they can view doing portfolio analysis, they can be working on multiple properties simultaneously so there's no ability to have to check out a property check in a property all of it can be done simultaneously allowing for a more collaborative environment. And again you can send out those snapshots so it doesn't have to just collaborate within your organization. If we collaborate with organizations around the world. 

Our underwriting work this may be our single biggest differentiating factor. So you get this rich 15 to 20 page workbook that has all of the analytics that are typically very difficult to find within these reports. So we've got excel where everyone kind of does their last mile analysis. They're going to layer on debt they're going to put in partnerships going to tiered participations. All this stuff is typically done by taking canned reports cutting and pasting into Excel. 

You know cutting and pasting into Excel you're going to introduce errors.  You know it's going to take you a long time. So we get rid of all that by having this underwriting workbook. We think this will save hundreds of hours for each client each month.  So this is the kind of stuff that we think has to be in an application to be fast and efficient in 2019.

So what we're talking about is a new era. were going to have a new era where people can openly collaborate fast efficient intuitive. No need for weeklong training sessions multi day training sessions. No need to engage another consultancy to get your users up on the application. Our DCF will be that solution that allow you to cleanly efficiently model from start to finish your last mile analysis and excel and we think we will change the industry with it. 


Thanks for your time.


David Unger: Full Transparency through IoT

David.001.jpeg

Filmed in partnership with Realcomm | IBcon.

From the edge, through the fog and into the clouds - a deep dive into the core components of IoT in commercial real estate today. David Unger, CEO of Sentient Buildings helps navigate current pain points in IoT and cloud infrastructure as well as how technology is bringing forth new solutions.


VIEW PRESENTATION:


Dave_Unger_Headshot.jpg

David Unger, CEO, Sentient Buildings

WEBSITE | TWITTER | LINKEDIN


VIDEO TRANSCRIPT:


Good afternoon everybody, My name is David Unger. I'm the CEO of Sentient Buildings. Sentient Buildings is a wireless IoT device infrastructure company where we integrate wireless devices to traditional BMS systems, platforms and we bring all of that data up to the cloud securely and reliably. 

So my presentation today is going to be on creating full transparency in buildings through IoT technologies in the subtitle - from the edge through the fog and into the clouds. 

How do you get full transparency of your data in/and controlling that data from the cloud back down to the edge.  So you're just looking at how we put these pieces together, what are the core components of an IoT network or design? You have the cloud the cloud's where you know the data is going to ultimately be pushed too, you have your subject here in the middle, the building, the edge is your edge device network. 

So how does that network function?  How are you getting data from the very edges of your building and not just from your central plant systems or from air handlers or from other operational technologies in the building? How do you get into the tenant spaces and collect data on temperature, humidity or how do you control individual terminal units in apartments and other things?

How do you get bi-directional with monitoring and control to the edge? then the fire concept here is all about distributing that computing power, right. So how do you distribute your computing power between the cloud and the edge?

How do you maintain it, manage your security, how do you maintain data across all systems across both the cloud and the edge? So there is talk about how those pieces get put together but let's just talk about some of the traditional kinds of problems that we try to solve for building owners and operators. The first one is wires. Wires are very constraining in buildings, in wired systems and wiring up sensor data and wiring up devices and control points. It becomes expensive to maintain those systems and you don't typically deploy to the edge in a way that makes sense for the building. Wired is a mass infrastructure, it's expensive to install maintain upgrade and extend. 

What we find is while you could potentially control every tack in a building, every electric baseboard heater in a building while you could do these things they're not economical or feasible in old construction or in retrofit projects. Paybacks for the owners to deploy to the edge are too long for them to even consider.  

What we really look at is how to achieve this full visibility and do it reliably with wireless. Wireless technologies typically in a lot of ways, is unreliable. It might be okay to monitor a temperature sensor but if you're controlling somebody pee tac unit or if you're doing something that needs to be done reliably and consistently you know you can't be subject to wireless interference or other problems that might arise with wireless device networks. 

So the way we look at this is we've divided wireless networks into two typologies. We look at the Star Network as having a central hub right that can coordinate and monitor devices that communicate directly to it. That Star Network provides basically a local area or a personal area wireless network within its face. 

So within a specific space it could be an apartment could be an office space but you have this local area wireless network and you could actually deploy on this network because it's now very short range. When I say short range I mean like 30 to 40 feet. 

If you could deploy low to no power and end nodes at the edge that can be powered by ambient light can be powered by kinetic energy so you don't even have to put batteries in those devices and it could be as simple as peeling and sticking something on a wall like a thermostat and getting readings back to your hub. The mesh comes in where these hubs act as repeaters on a mesh. 

So you have your star network at each node and each hub becomes a repeater in there you form a building wide area network where all the mesh nodes communicate with one another and they report back to a central gateway or central system in the building and that way you achieve full reliable coverage across the entire site. 


Once you have the wireless network in place, what you can do with it? What kind of devices can you deploy and you could deploy these devices very cost effectively, temperature sensors actuators  hours occupancy sensors energy meters and you could deploy them without having to run power or communication wiring to them. So it becomes a very inexpensive deployment and not only that it becomes reliable in terms of wireless range and communication. 

Now you're bringing all of the wireless data back to a central point. That's great. But now what typically happens is the data still remain separate from existing building management systems. Wireless IoT data should be simply extending existing BMS platforms. They should not be their own platform or their own system. The latest IoT device networks are typically proprietary. You have to use some specific kind of sensor, they might have their own portal platform or their own local client to access the system. So you want to basically build a platform that allows for extension of this IoT device system so that it can be used by other systems in the building.

The other thing that happens across multiple systems is your data definitions are not in sync. They're not homogenized. They're not normalized. The way that you define your data is different across multiple systems so you need a simple way to bring all that data definitions together so that they're defined correctly across all your platforms so that you can identify systems and platforms consistently to perform analytics, to run alarming and create issues across the system. 

It's very important to get that straightened out. Where  these edge to fog gateways that bridge the divide fit in is, you create this fully secure VPN network to your cloud. So now you've secured your network of all this data. You have integration of your IoT receivers into that network and then you also create onsite data storage and edge computing power through a central fog gateway.  

Now both the wireless network and the IoT device network can communicate to the other building systems and the same goes for the building systems that were traditionally not connected to these device networks. 

Then pushing that data right up to the cloud so you have your IoT systems and you have traditional BMS platforms all coming together in a central system. 


There are many cloud platforms that are out there, you know performing analytics against the data or providing other services against the data,  it becomes a problem because you still don't get a comprehensive view of operations. Many users have to log into multiple systems in order to evaluate and analyze their data. So really what's needed is a central system to aggregate the data at scale with a suite of API eyes to these external systems in the cloud. 

There needs to be the single pane of glass where the data exists in the cloud and is moderated and controlled in the cloud. Then you have integration so all the other systems that you might need to retrieve data from provide a standard compliant data integration platform with a single pane glass view into that system and then you integrate the value chain of all of these other providers in the cloud. 

Eventually what you'll get is a method of setting the stage for full integration and collaboration across all cloud platforms so that you can easily share data across systems,  distribute data to your engineering and energy consulting firm so that they can evaluate that data and help the building owner make decisions on capital projects, for example the tenants and residents can gain access to their thermostats easily. 

The owner operator could grant access to the thermostat without them having to put their own nest device in or some other type of Wi-Fi device hvac service companies could gain access to enact this. This access control system where data is shared so that they can evaluate problems with your air handler or your boiler plant or your chiller plant.  You get full transparency all the way down to the device level and now you're providing full transparency to all the collaborators who actually need access. 

If they had access they can provide better services to the building, so what is this roadmap to transparency look like?  wireless start a mesh remote control nodes that connect seamlessly to existing building systems. So really designing your wireless IoT device network so that it’s standardized and compliant with existing systems. You want to support standard compliant edge devices while maintaining this from robust backhaul. You want to eliminate the need going forward for power communication wiring. 

We recently did a project in a 2 million square foot building where you can put a device now anywhere in that building, a sensor, thermostat, any control point, you can just place the device in the building and it will come up on the network and be visible in the cloud. So that really allows complete flexibility. The types of sensors that you use and you could use at much lower costs than was traditionally available and then really getting this open protocol cloud platform that's able to not only receive the data from the building systems but also fully integrate with all other cloud based platforms for a fully robust platform in the cloud that has multiple data sources and can really give you a single glass pane into the view of operations.